Status Page
The Status Page feature provides a real-time view of platform health, scheduled maintenances, and declared incidents. All data is stored as Kubernetes CRs — no external database required.
Overview
    flowchart TD
    User["kubectl apply\n(Component / Maintenance / Incident)"]
    K8s["Kubernetes API Server\n(etcd)"]
    Controllers["Controllers\n(Component, Maintenance, Incident)"]
    ReadStore["ReadStores\n(in-memory)"]
    API["Connect gRPC API\nStatusService"]
    MCP["MCP Server\n/mcp/status"]
    WebUI["Web UI\nStatusPage"]

    User -->|"kubectl apply -f"| K8s
    K8s -->|"watch events"| Controllers
    Controllers -->|"ProjectToReadStore"| ReadStore
    Controllers -->|"patch status"| K8s
    ReadStore -->|"reader.List()"| API
    ReadStore -->|"reader.List()"| MCP
    API -->|"TanStack Query"| WebUI
Custom Resources
Three CRDs work together to model the status page:
| CRD | Linked to Portal | Description |
|---|---|---|
| Component | spec.portalRef | A platform service/infrastructure with an operational status |
| Maintenance | spec.portalRef | A scheduled maintenance window affecting one or more components |
| Incident | spec.portalRef | A declared incident with a timeline of updates |
Component
Represents a monitored platform component (e.g., GKE cluster, Cloud SQL, API Gateway).
Manual creation
apiVersion: sreportal.io/v1alpha1
kind: Component
metadata:
  name: gke-prod
  namespace: sreportal-system
spec:
  displayName: "GKE Production"
  description: "Main Kubernetes cluster"
  group: "Infrastructure"
  portalRef: main
  status: operational
  link: "https://console.cloud.google.com/kubernetes"
Auto-creation from annotations
Components can also be created automatically by annotating K8s source resources (Service, Ingress, Gateway, etc.) or DNS CRs with sreportal.io/component:
apiVersion: v1
kind: Service
metadata:
  name: api-server
  annotations:
    external-dns.alpha.kubernetes.io/hostname: "api.example.com"
    sreportal.io/portal: "production"
    sreportal.io/component: "API Gateway"
    sreportal.io/component-group: "Infrastructure"
    sreportal.io/component-description: "Main API ingress"
    sreportal.io/component-link: "https://grafana.internal/d/api"
spec:
  type: LoadBalancer
  ports:
    - port: 443
Auto-managed components are labeled sreportal.io/managed-by and follow annotation-driven lifecycle: metadata is synced on every reconcile, spec.status is never overwritten, and the component is deleted when the annotation is removed. See Annotations for details.
Key fields:
| Field | Description |
|---|---|
spec.displayName | Human-readable name shown on the status page |
spec.group | Logical grouping (e.g., “Infrastructure”, “Applications”, “Data”) |
spec.status | Manually declared status: operational, degraded, partial_outage, major_outage, unknown |
spec.link | Optional external URL (dashboard, console) |
status.computedStatus | Effective status — overridden to maintenance when an active maintenance targets this component |
Maintenance
Represents a scheduled maintenance window. The controller automatically computes the phase (upcoming / in_progress / completed) and requeues at exact transition times.
apiVersion: sreportal.io/v1alpha1
kind: Maintenance
metadata:
  name: db-migration-v42
  namespace: sreportal-system
spec:
  title: "Database migration — schema v42"
  description: "PostgreSQL schema migration. ~30s write interruption."
  portalRef: main
  components:
    - cloud-sql-prod
  scheduledStart: "2026-03-28T02:00:00Z"
  scheduledEnd: "2026-03-28T04:00:00Z"
  affectedStatus: maintenance
Phase logic:
Now < scheduledStart              → upcoming
scheduledStart ≤ Now ≤ scheduledEnd → in_progress
Now > scheduledEnd                → completed
During in_progress, affected components’ computedStatus is overridden to spec.affectedStatus.
Incident
Represents a declared incident with a chronological timeline. Updates are appended to spec.updates via kubectl edit or kubectl patch.
apiVersion: sreportal.io/v1alpha1
kind: Incident
metadata:
  name: api-latency-20260326
  namespace: sreportal-system
spec:
  title: "API latency spike"
  portalRef: main
  severity: major
  components:
    - api-gateway
  updates:
    - timestamp: "2026-03-26T14:30:00Z"
      phase: investigating
      message: "P99 latency increase detected."
    - timestamp: "2026-03-26T15:52:00Z"
      phase: resolved
      message: "Rollback completed. Latency nominal."
Computed fields (in status):
| Field | Description |
|---|---|
currentPhase | Phase of the most recent update (by timestamp) |
startedAt | Timestamp of the first update |
resolvedAt | Timestamp of the first resolved update |
durationMinutes | resolvedAt - startedAt in minutes |
Web UI
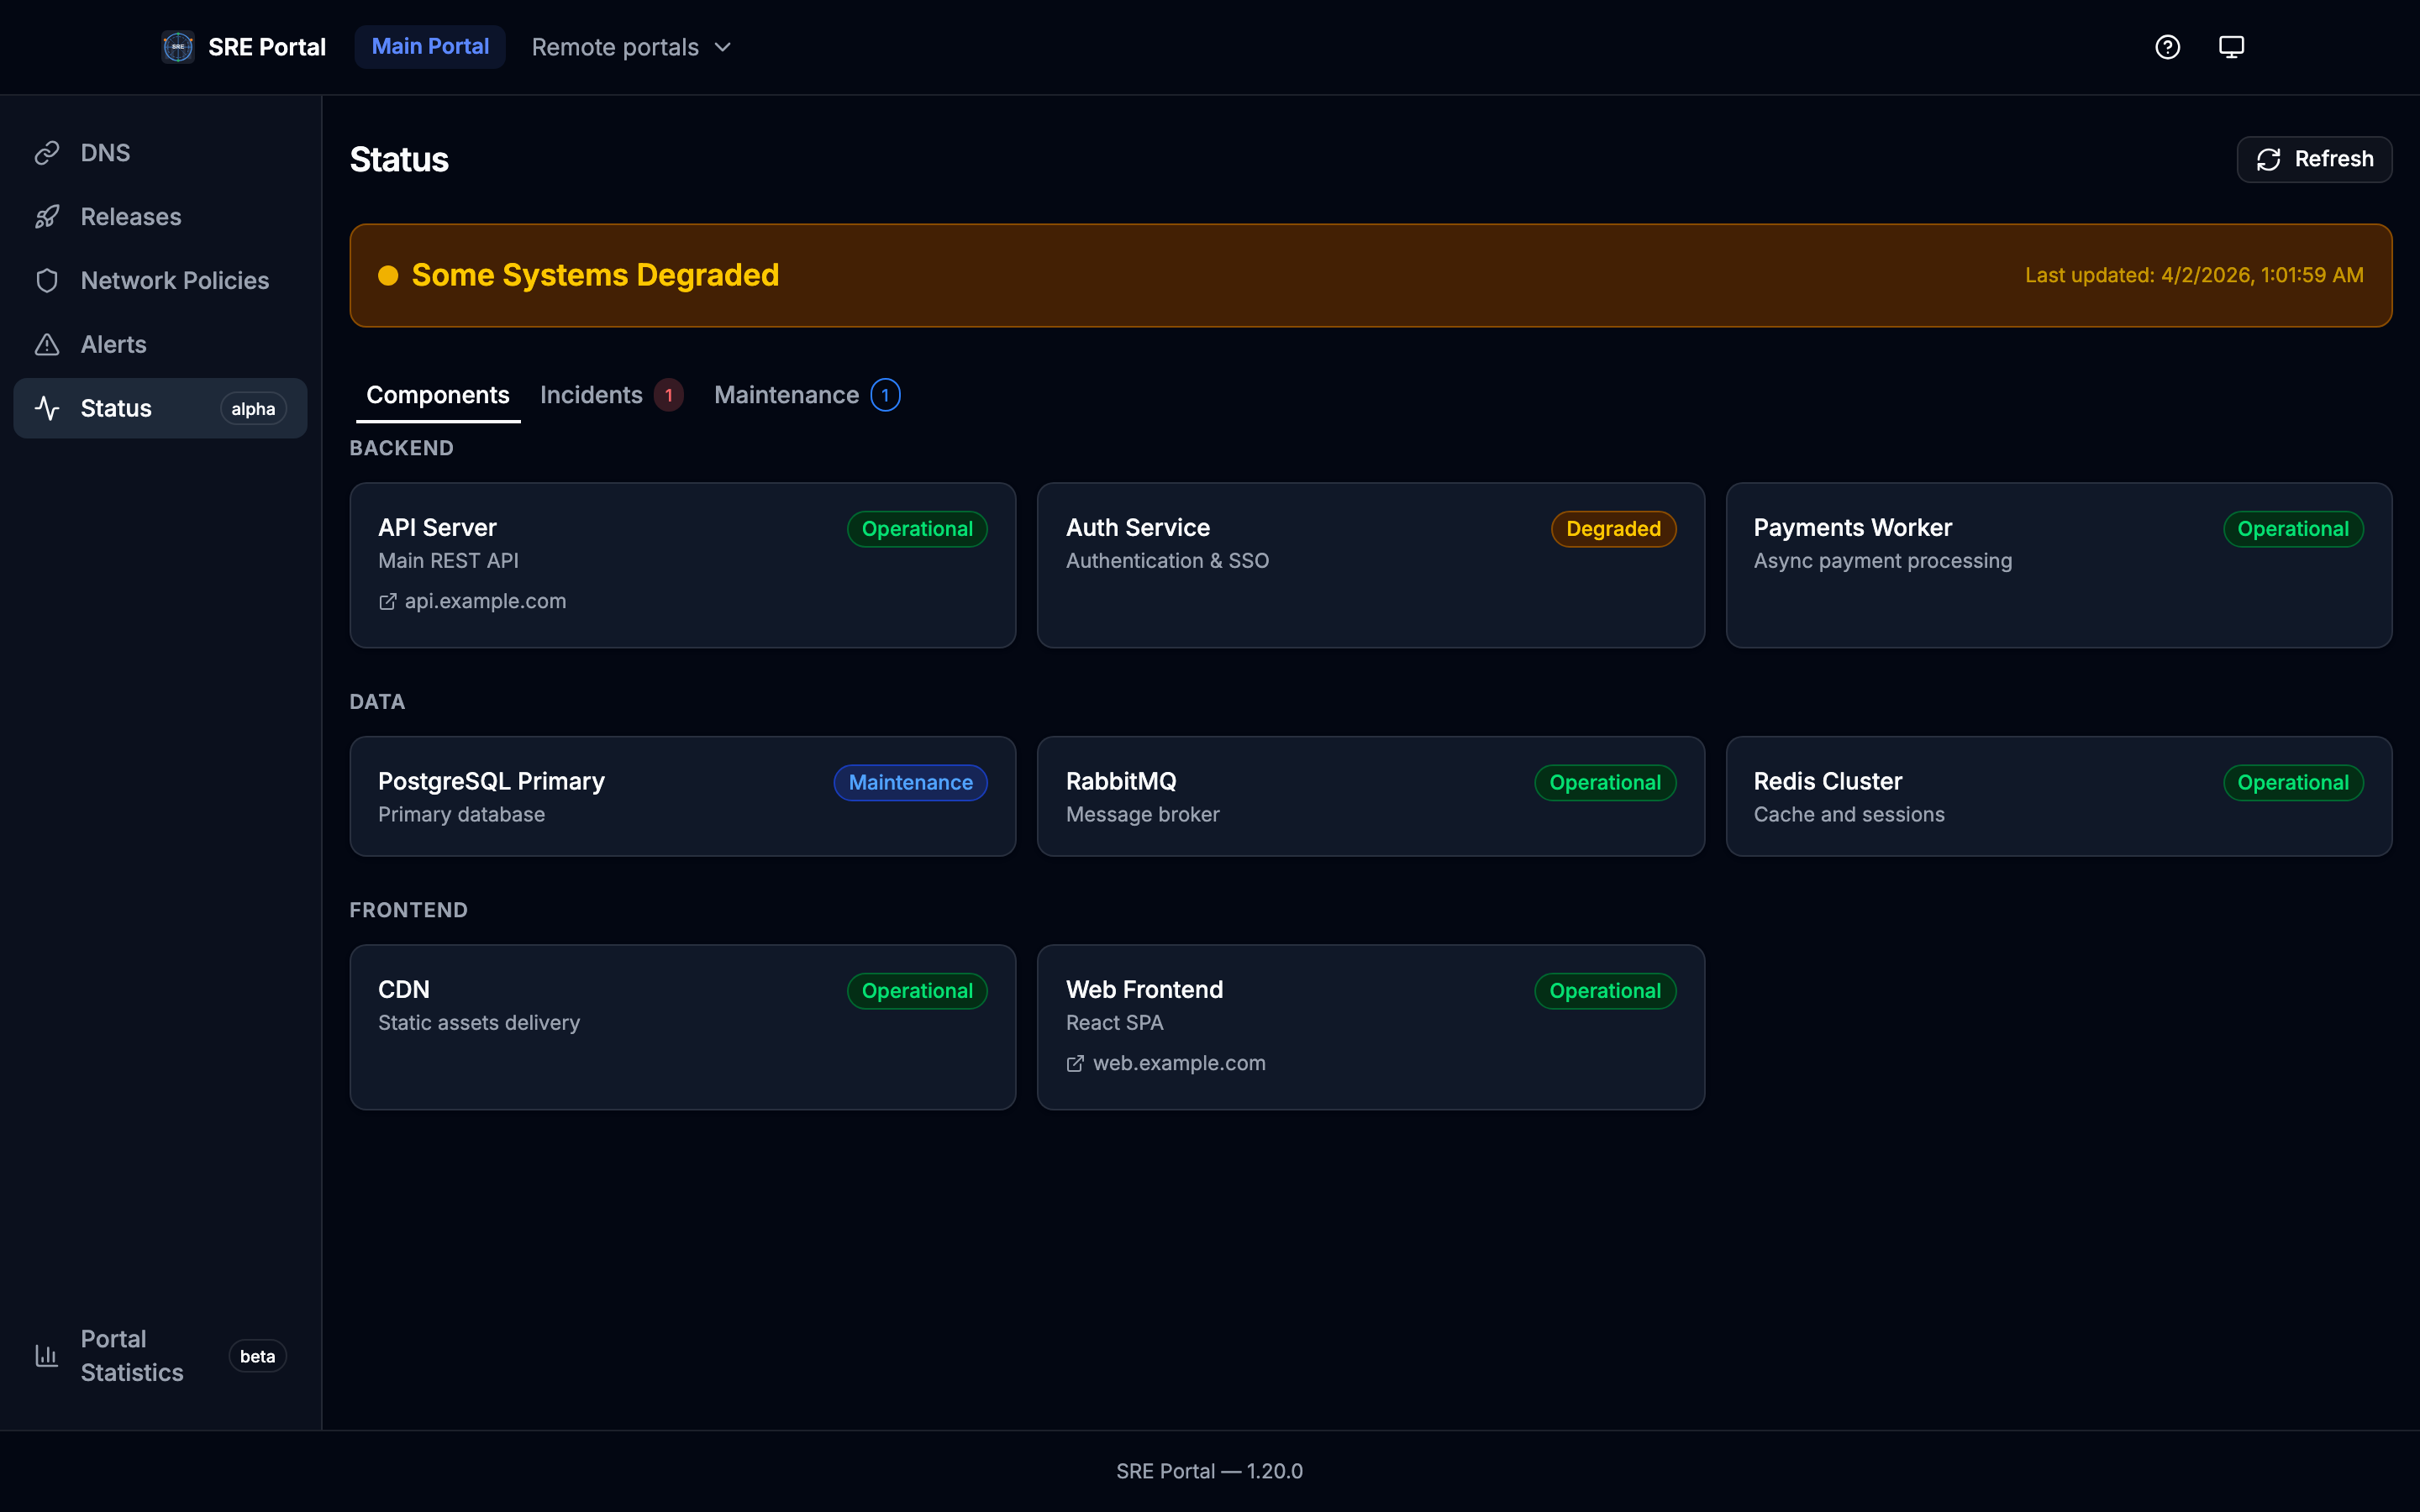
The status page is accessible at /:portalName/status and is organized into three tabs:
Components
Displays a global status banner (worst status across all components) and a grouped component grid (responsive 1/2/3 columns). Each component shows its computed status, display name, description, and an optional external link.
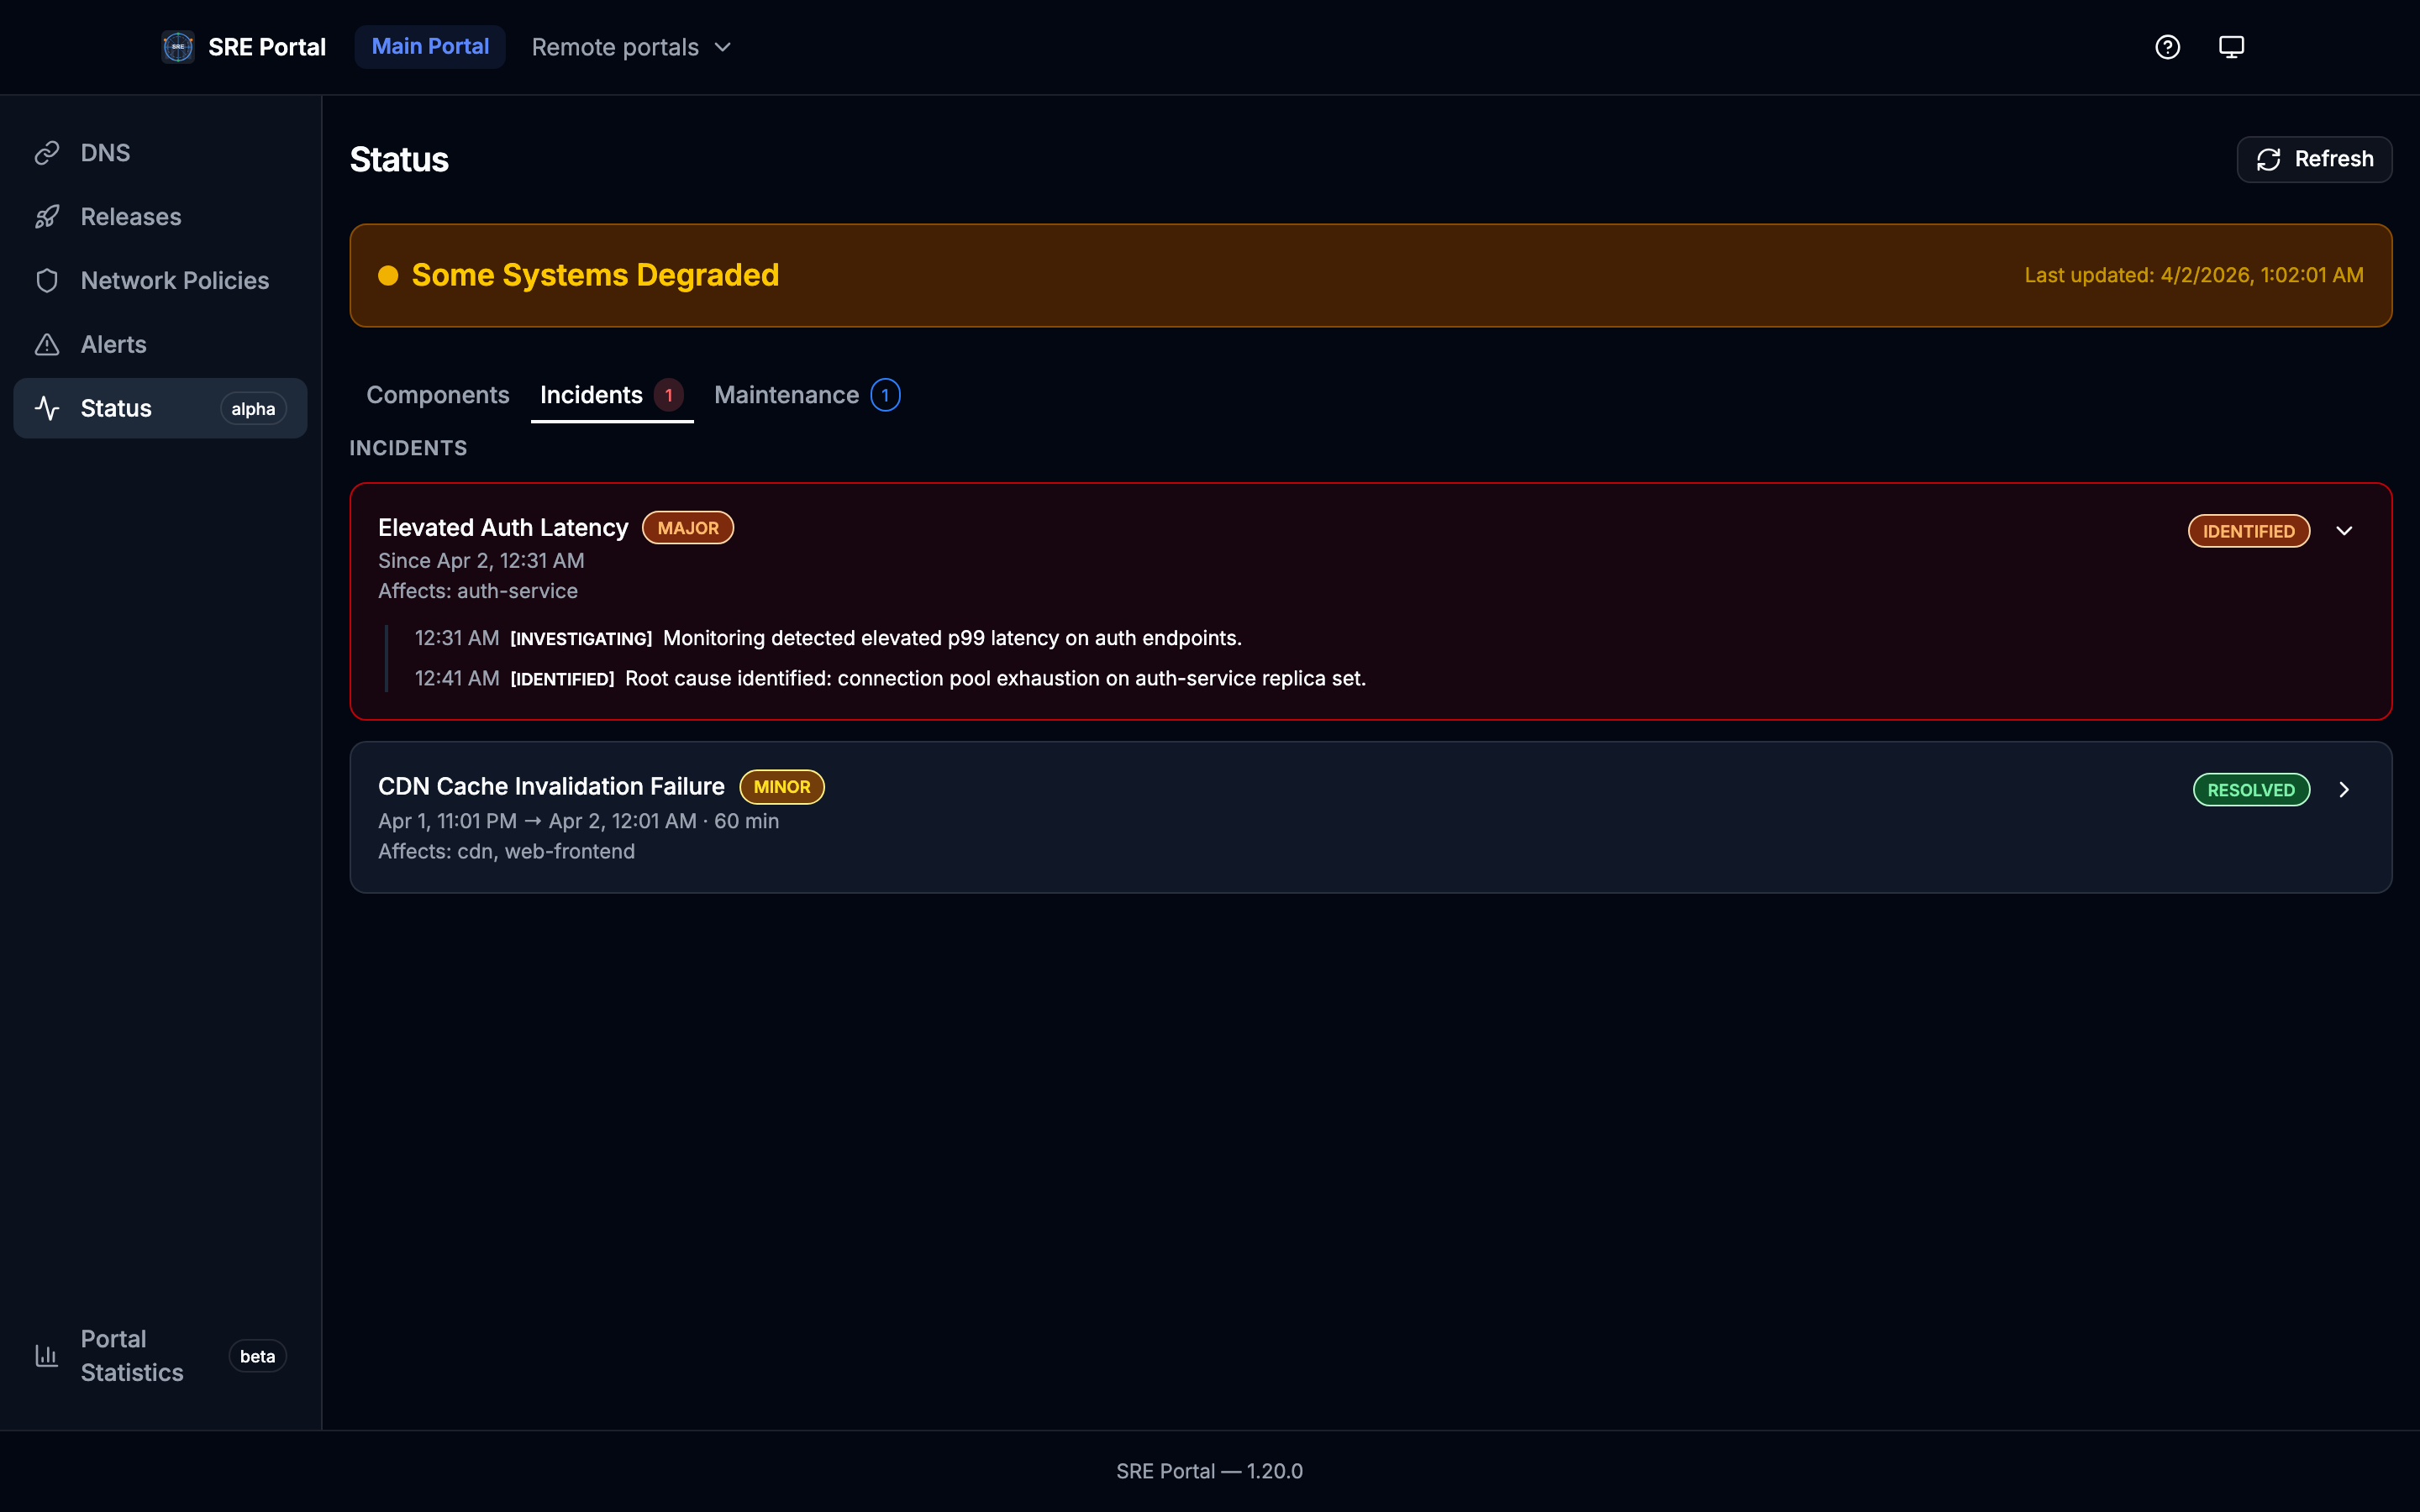
Incidents
Active incidents appear on top (expanded by default), resolved incidents below (last 10, collapsible timeline). Each incident shows severity, phase, affected components, and chronological updates.
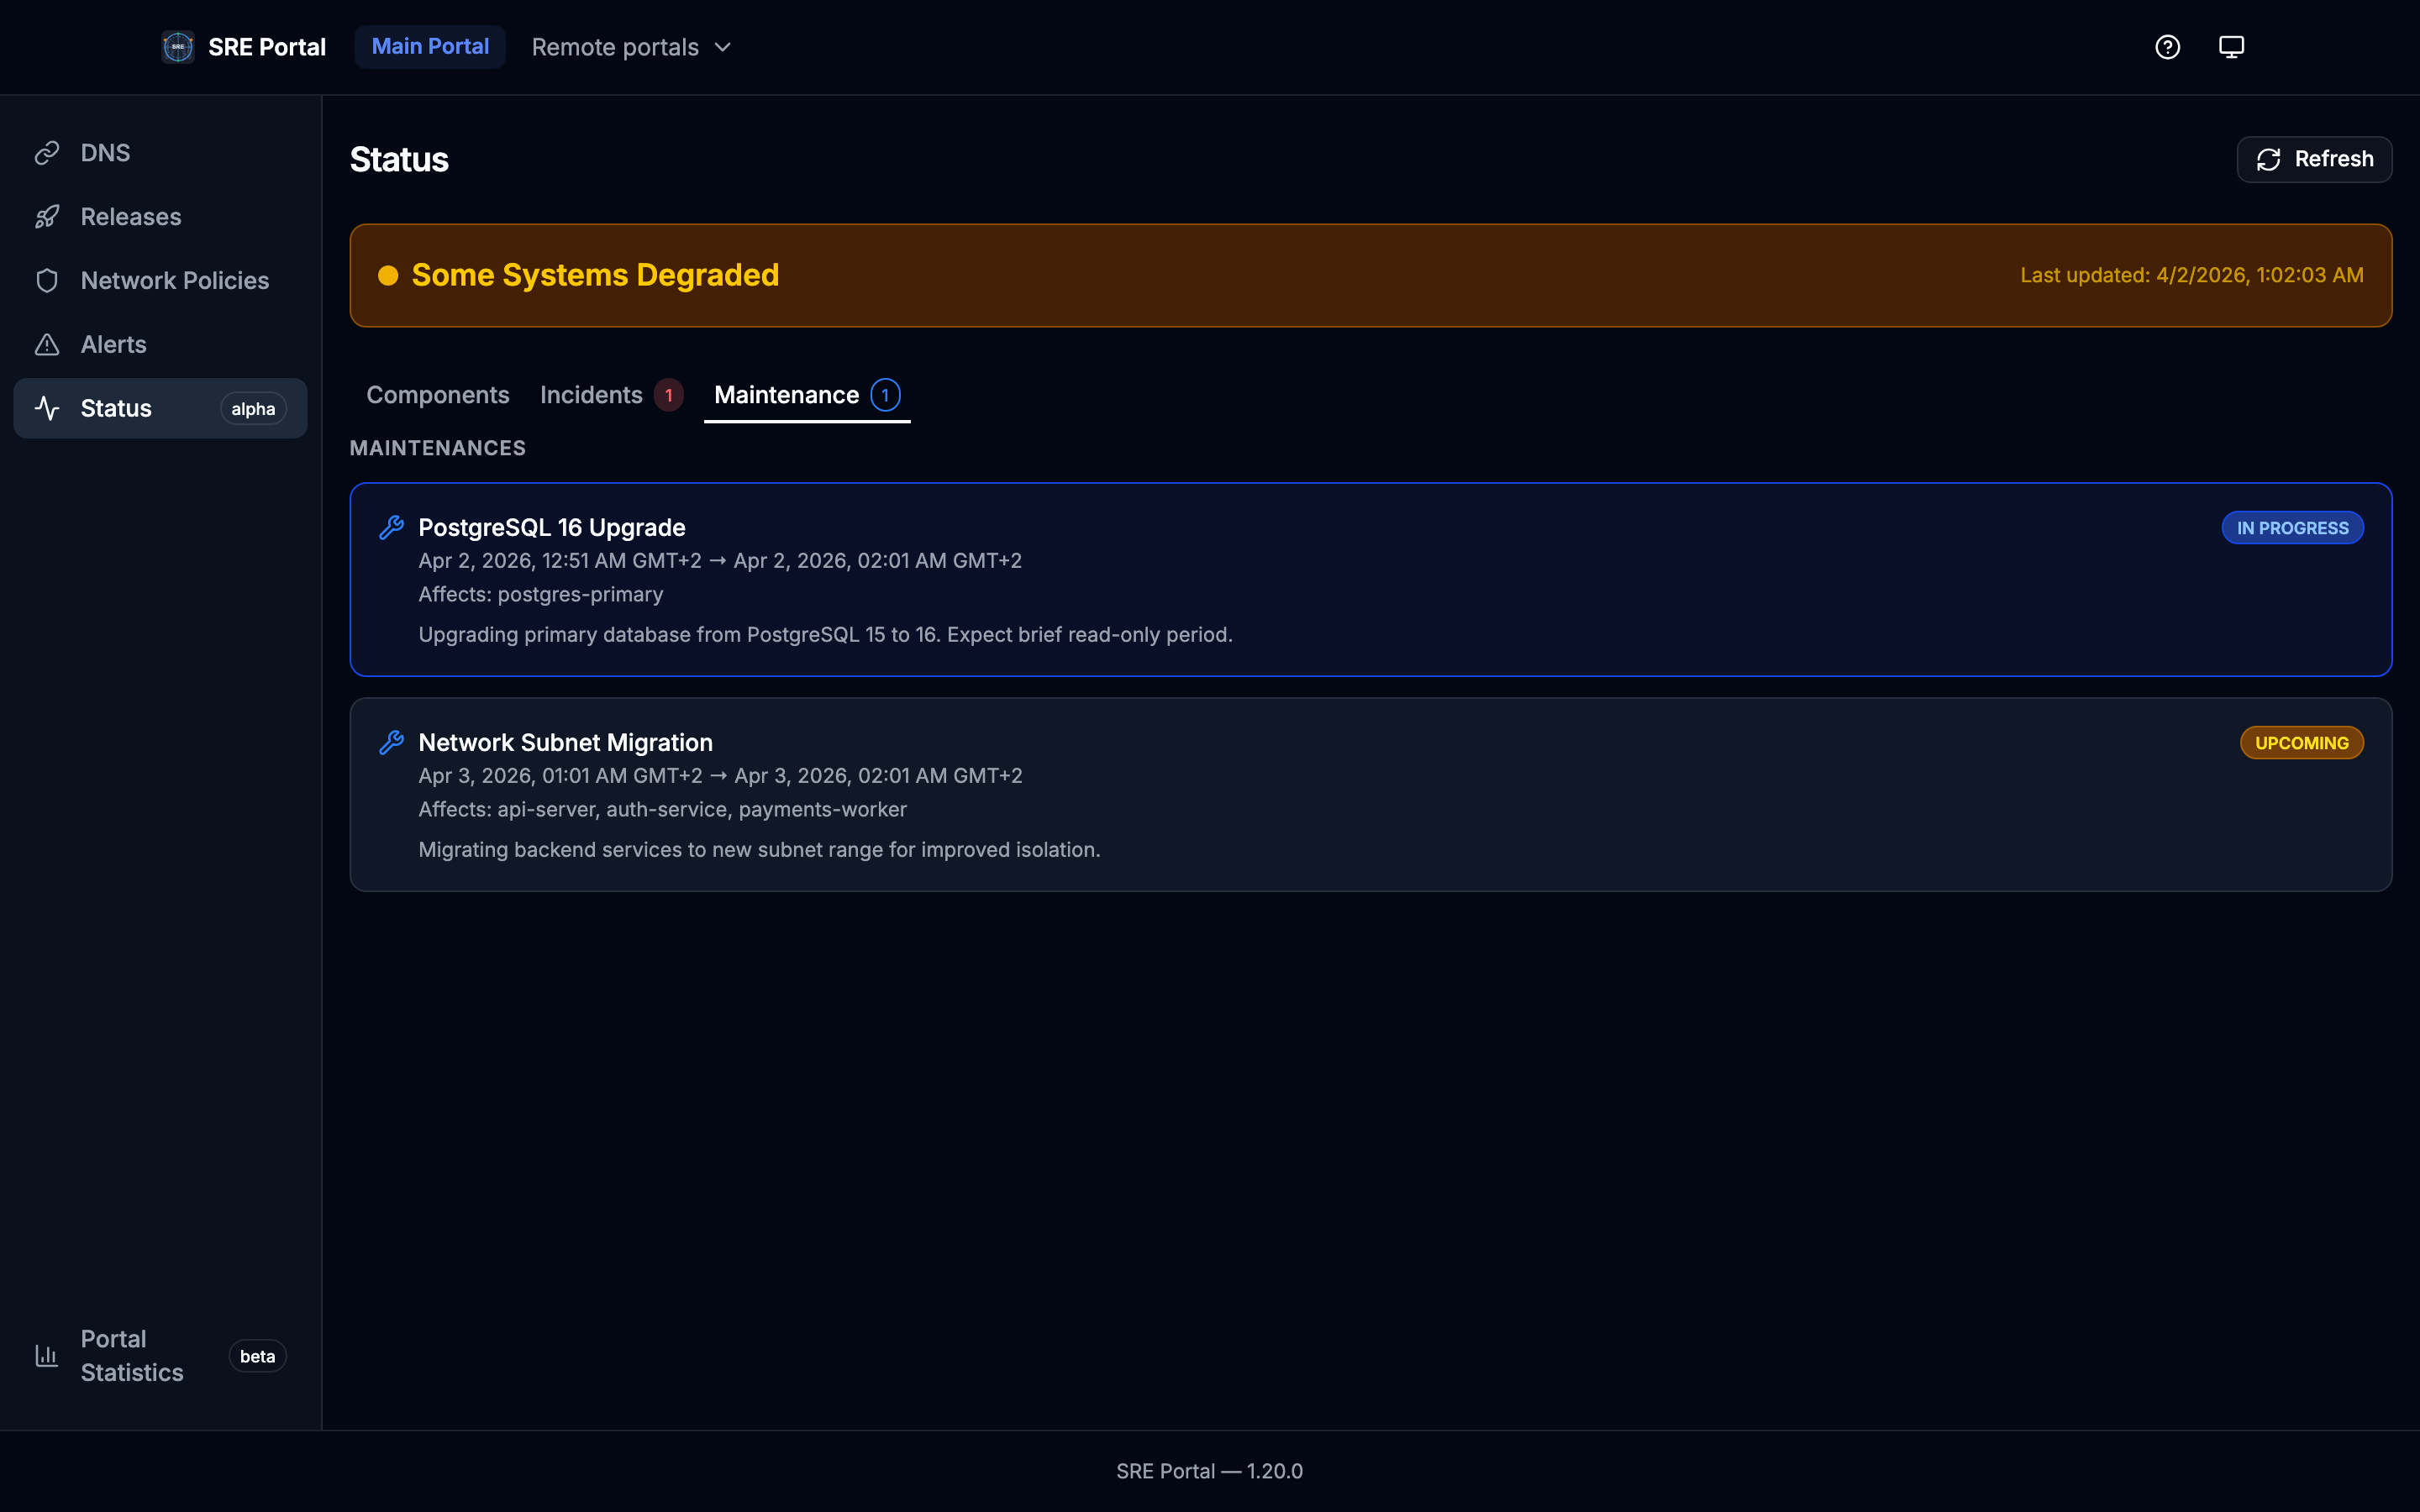
Maintenance
Scheduled and ongoing maintenance windows, sorted: in_progress → upcoming → completed (last 5). Each entry shows title, affected components, scheduled time range, and current phase.
API
Connect gRPC (StatusService)
| RPC | Description |
|---|---|
ListComponents | List components (filters: portal_ref, group) |
ListMaintenances | List maintenances (filters: portal_ref, phase) |
ListIncidents | List incidents (filters: portal_ref, phase) |
MCP (/mcp/status)
| Tool | Description |
|---|---|
list_components | List components with status |
list_maintenances | List maintenance windows |
list_incidents | List incidents |
get_platform_status | Aggregated platform health summary |