Web UI
SRE Portal includes a React single-page application served directly by the operator.
Accessing the Dashboard
The web UI is served on port 8090 by default. Forward the port to access it locally:
kubectl port-forward -n sreportal-system svc/sreportal-controller-manager 8090:8090Then open http://localhost:8090 in your browser.
Routes
| Route | Description |
|---|---|
/ | Redirects to /main/links |
/:portalName/links | Displays FQDNs for the specified portal |
/:portalName/dashboard | Prometheus metrics charts (operator registry) |
/:portalName/alerts | Displays Alertmanager resources and active alerts for the portal |
/:portalName/netpol | Displays network policy flow graph for the portal |
/:portalName/releases | Displays release events for a given day (main portal only) |
/:portalName/status | Status page with components, incidents, and maintenance tabs |
/:portalName/images | Displays Docker image inventory grouped by registry |
/help | MCP setup instructions (all MCP endpoints) and available tools |
The root URL redirects to the main portal’s links page. Each portal has its own DNS (links), Dashboard, Network Policies, and (when applicable) Releases and Alerts routes.
Sidebar
When viewing a portal, a left sidebar shows:
- DNS — navigates to
/:portalName/links(FQDN list) - Dashboard — navigates to
/:portalName/dashboard(metrics charts; labeled beta) - Releases — shown only on the main portal when at least one Release CR exists; navigates to
/:portalName/releases - Network Policies — navigates to
/:portalName/netpol(network flow graph) - Status — navigates to
/:portalName/status(components, incidents, maintenances) - Images — navigates to
/:portalName/images(image inventory grouped by registry) - Alerts — shown only if the portal has at least one Alertmanager resource; navigates to
/:portalName/alerts
Features
FQDN Display
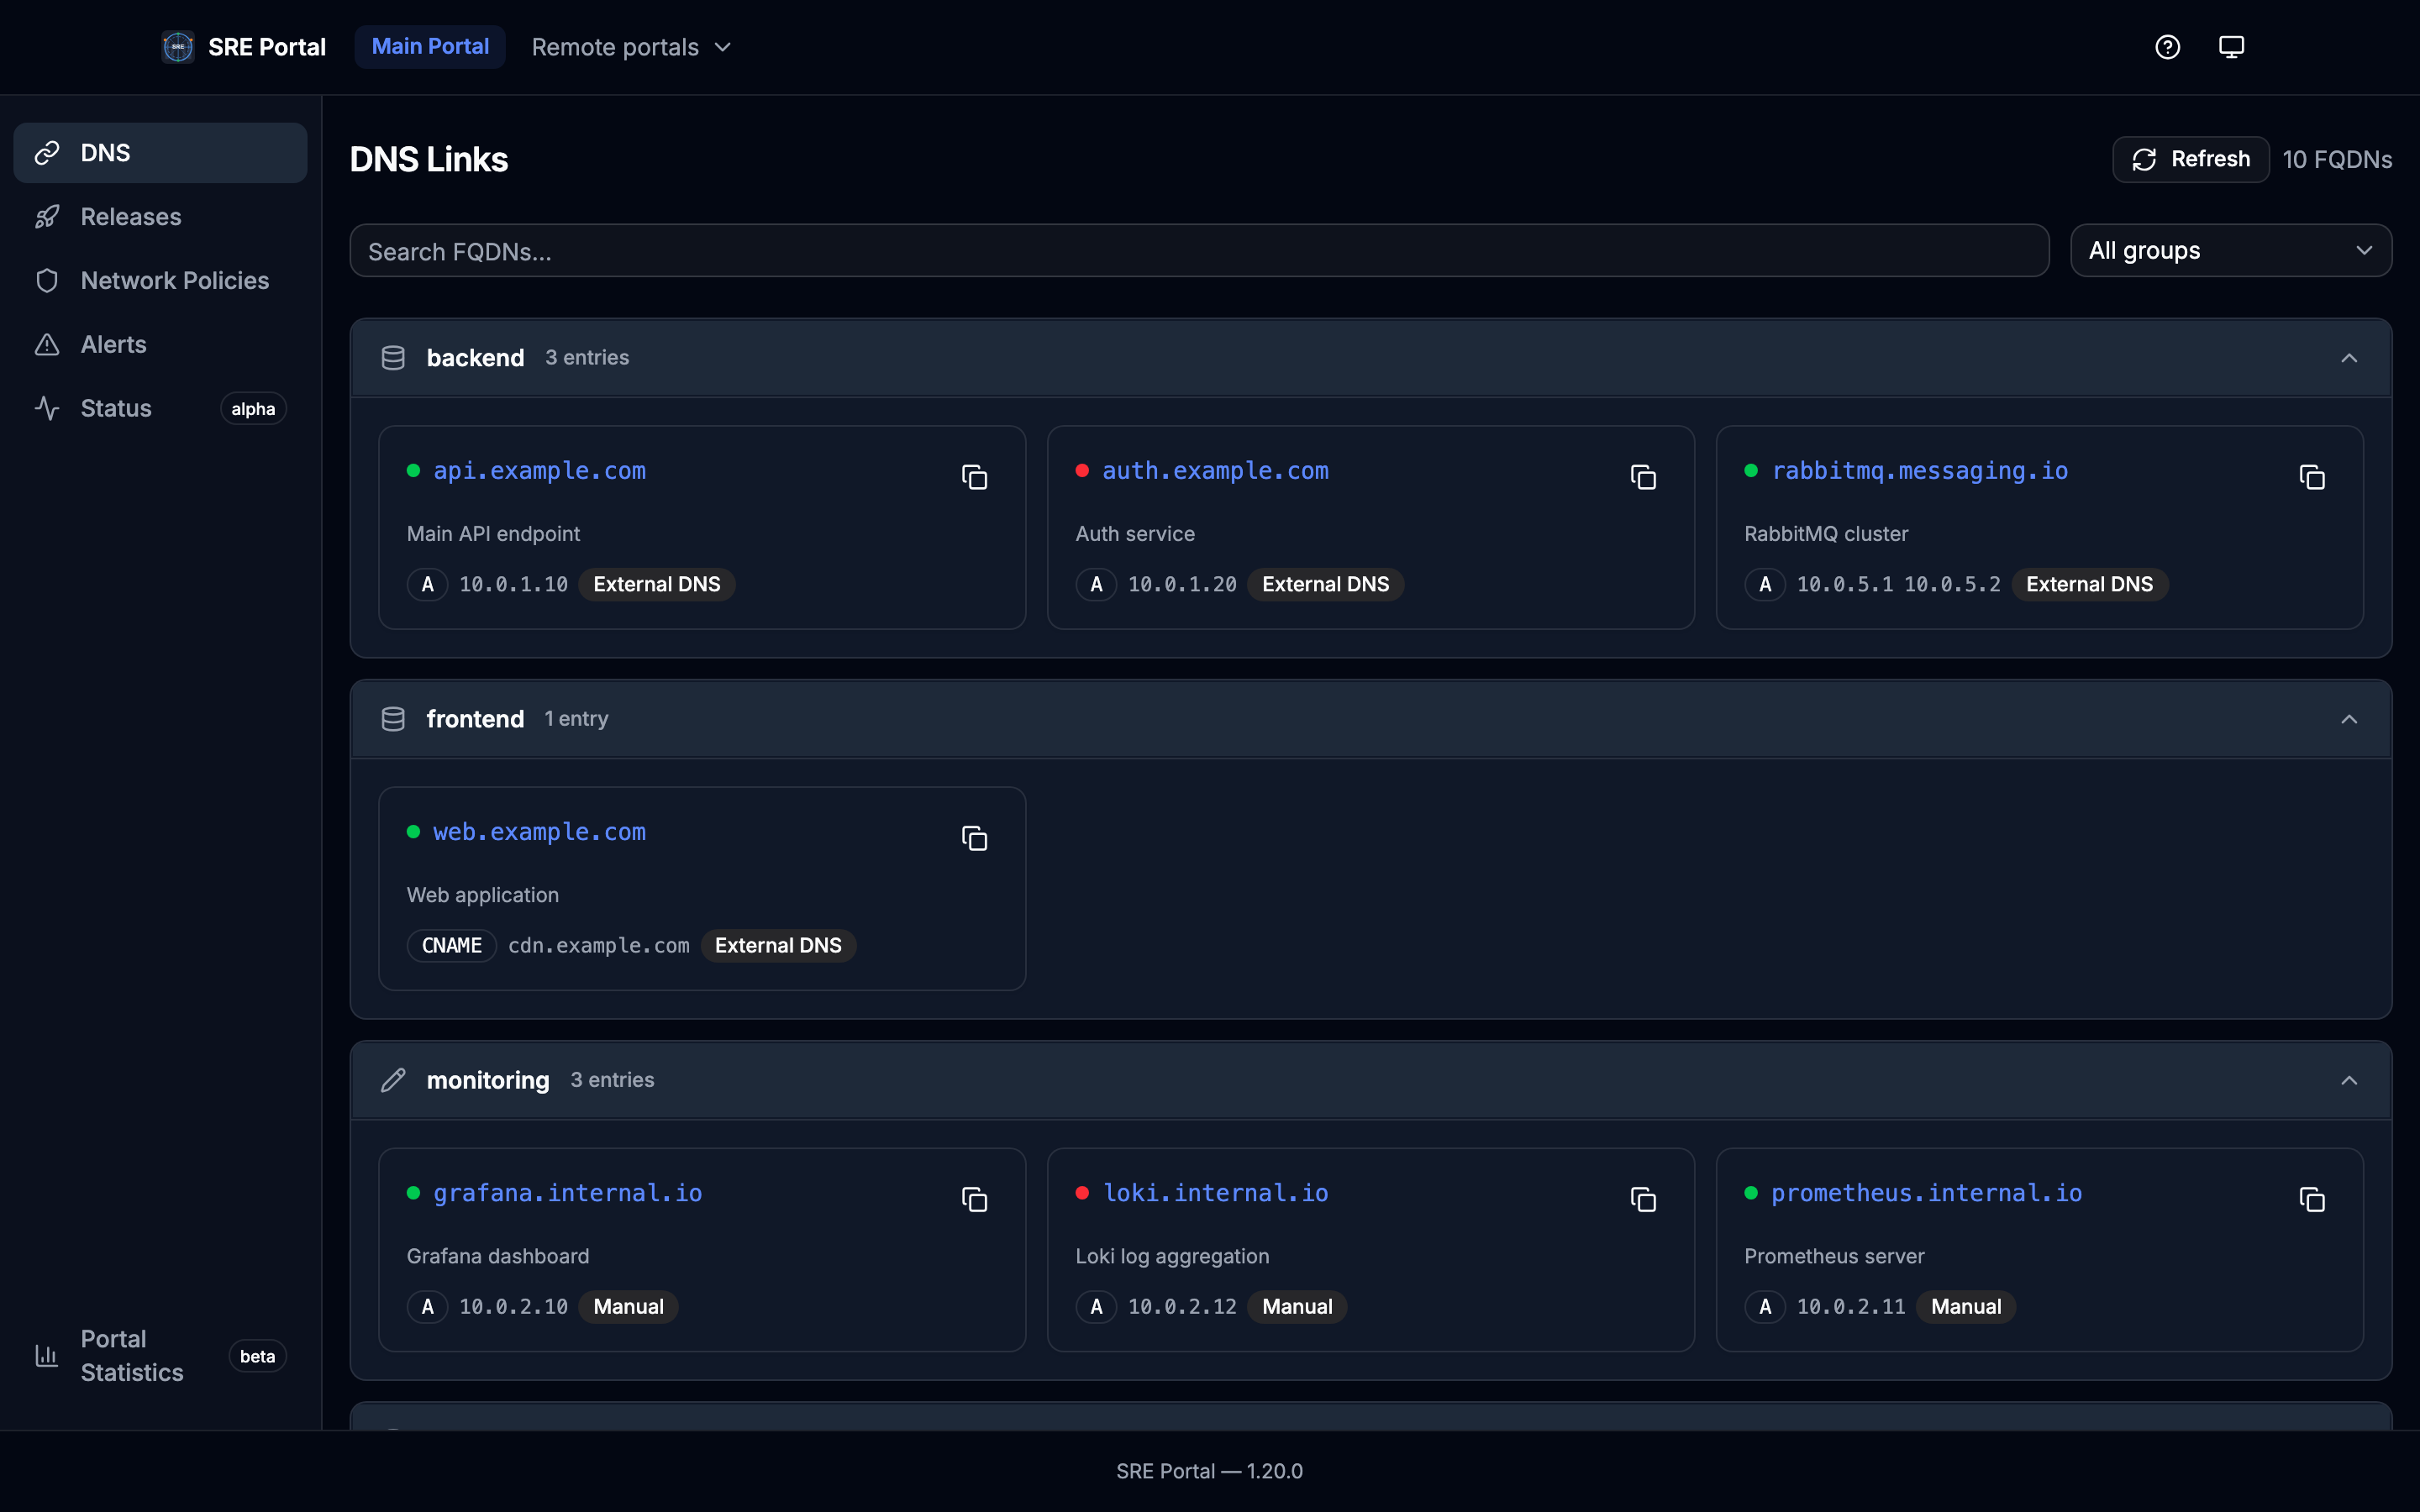
The links page shows all FQDNs aggregated for the selected portal. FQDNs are displayed with their record type, targets, and description.
Grouping
FQDNs are organized into groups based on:
- Source:
manual(from DNS CR spec),external-dns(auto-discovered), orremote(fetched from a remote portal) - Group name: determined by annotations, labels, namespace mapping, or the default group (see Annotations)
Search and Filters
The links page provides:
- Search: filter FQDNs by name
- Source filter: show only
manual,external-dns, orremoteentries - Namespace filter: filter by originating namespace
Alerts Page
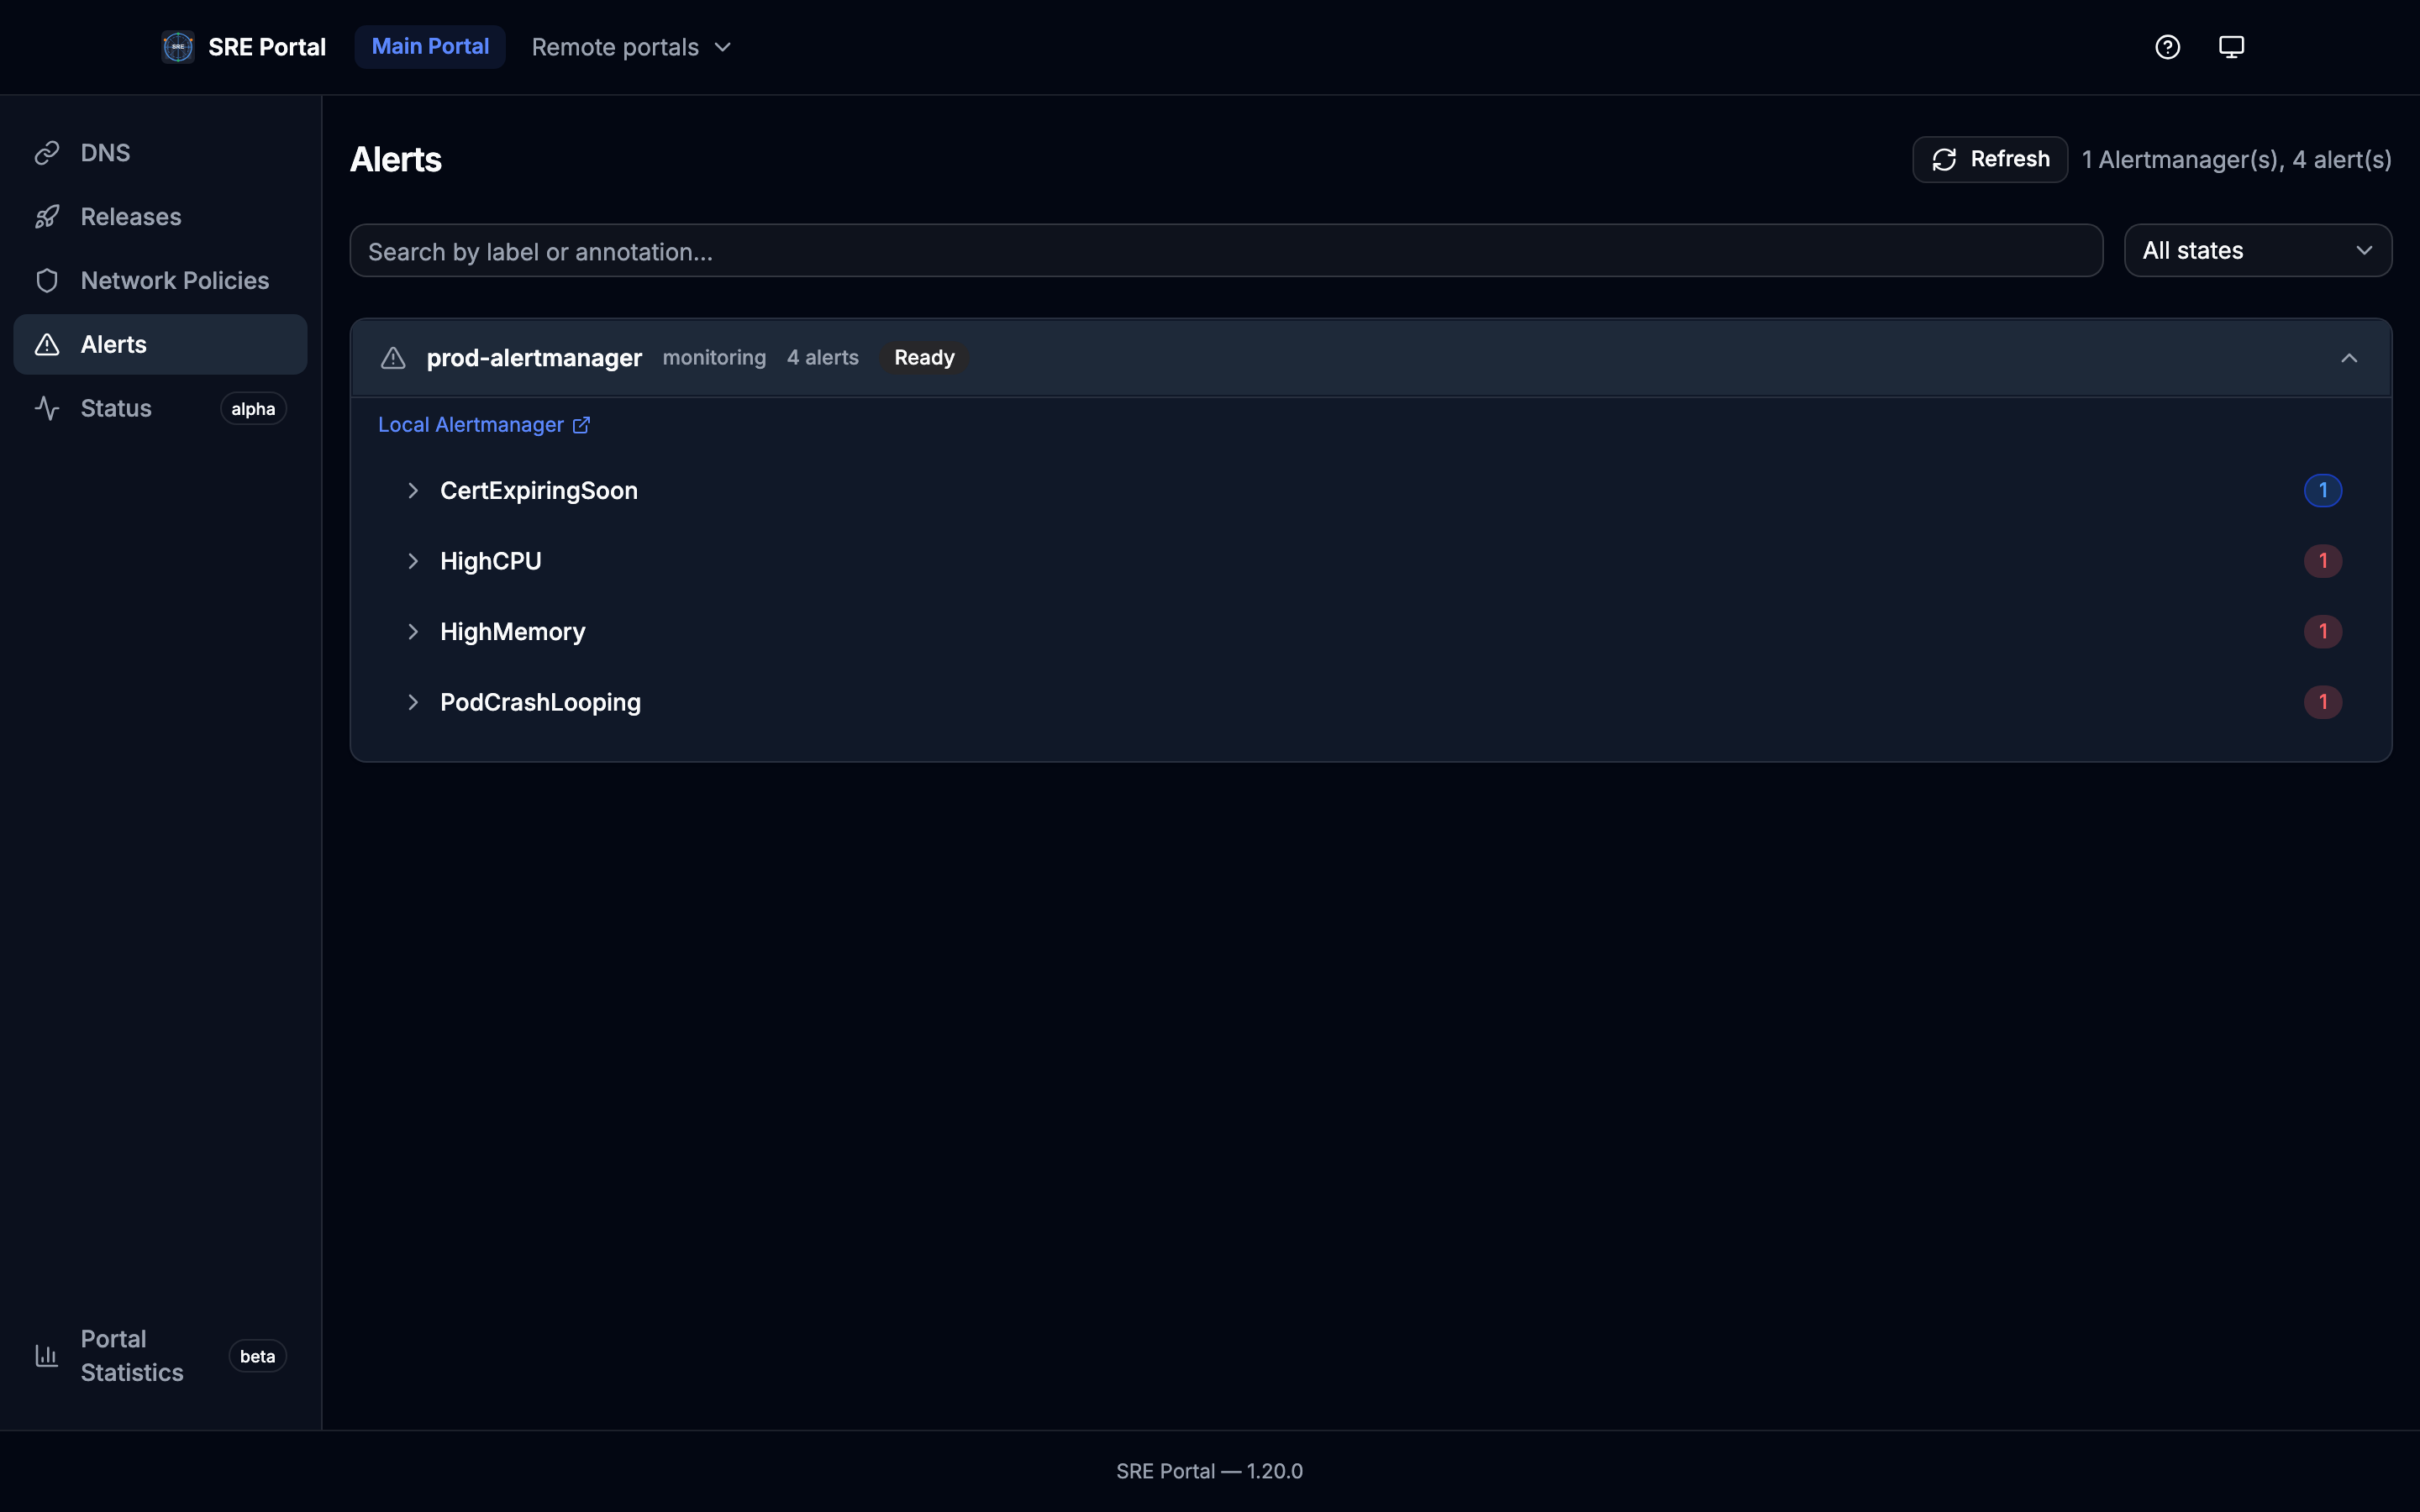
For portals that have Alertmanager resources, the Alerts page lists each Alertmanager CR with its active alerts. You can filter by search text and alert state (e.g. active, suppressed). Each resource is shown in a collapsible card with labels, annotations, and timestamps.
Network Policies Page
The Network Policies page visualizes network flows discovered from Kubernetes NetworkPolicies and GKE FQDNNetworkPolicies. It provides three tabs:
- Flow Matrix — lists every service with outgoing and incoming flows, collapsible by namespace
- Cross-Namespace — aggregated matrix showing flow counts between namespaces
- Flow Explorer — select a resource to see its direct incoming and outgoing flows in a butterfly layout, grouped by namespace; each flow shows a used indicator (check/cross) when a flow observer (Hubble/Prometheus) is available; click any connected service to navigate to it
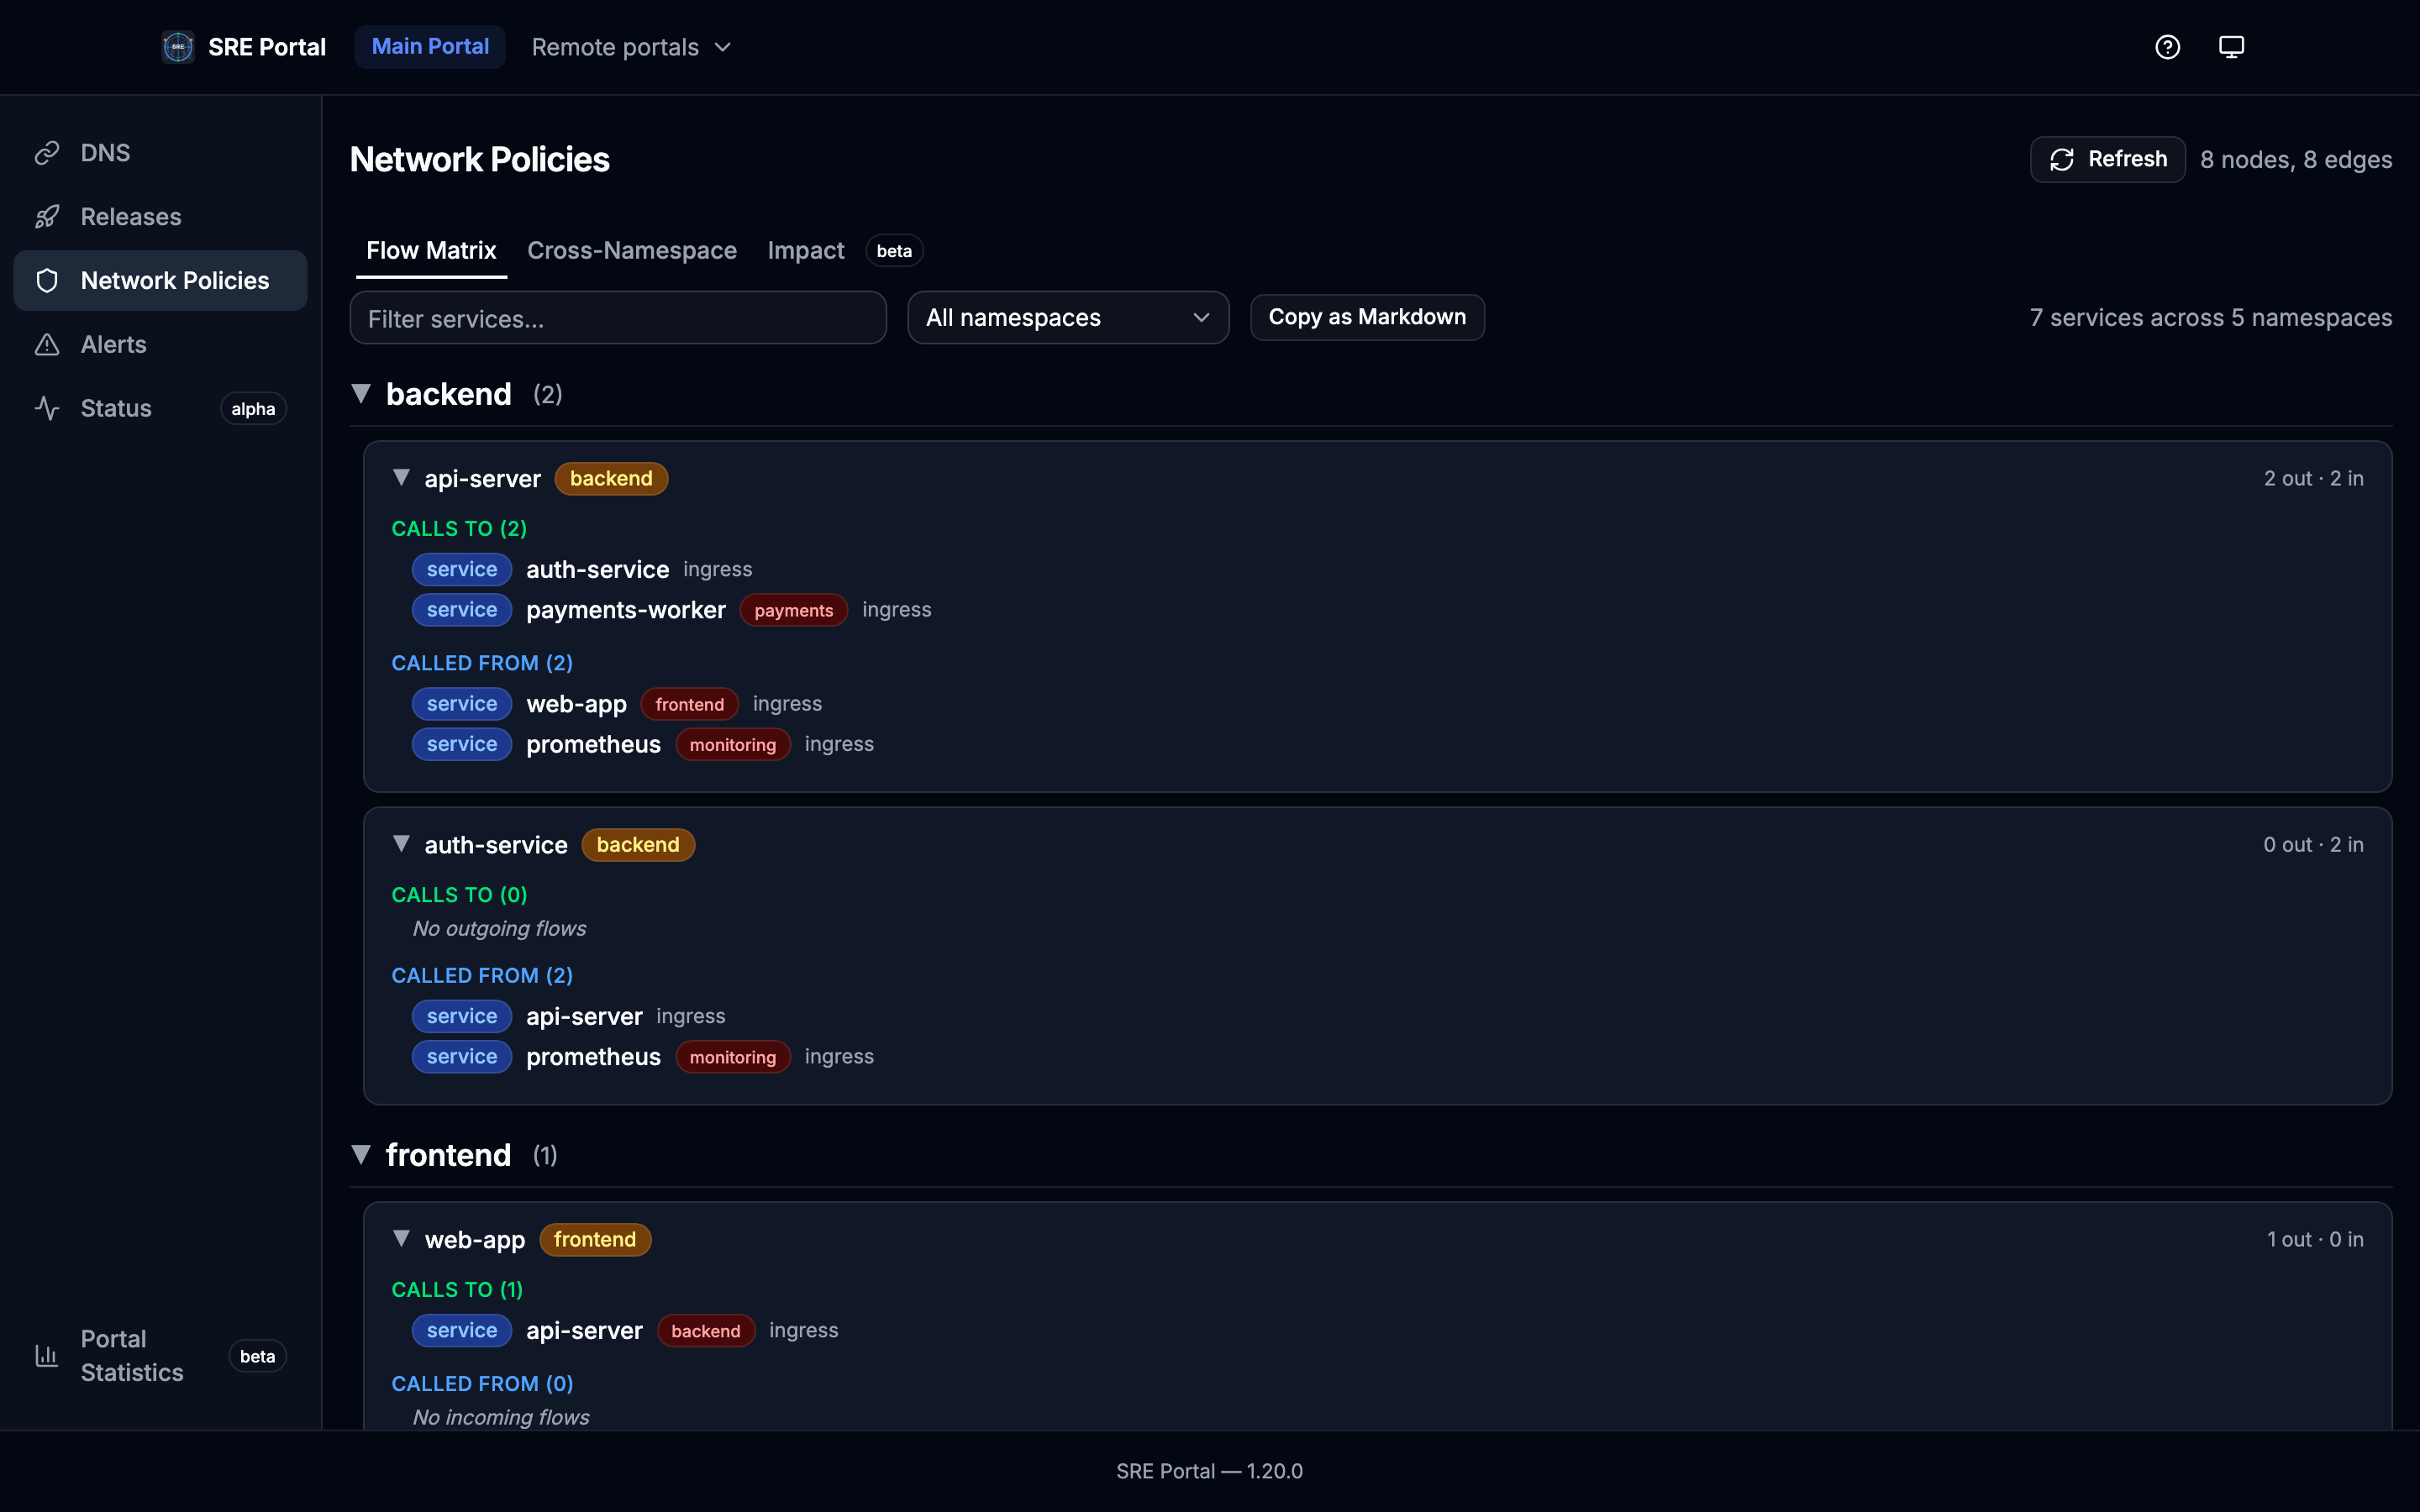
The graph data is computed by the NetworkFlowDiscovery controller and stored in FlowNodeSet/FlowEdgeSet CRDs. For remote portals, the data is fetched via the Connect API and synced locally. See Network Flow Discovery for CRD definitions and API details.
Releases Page
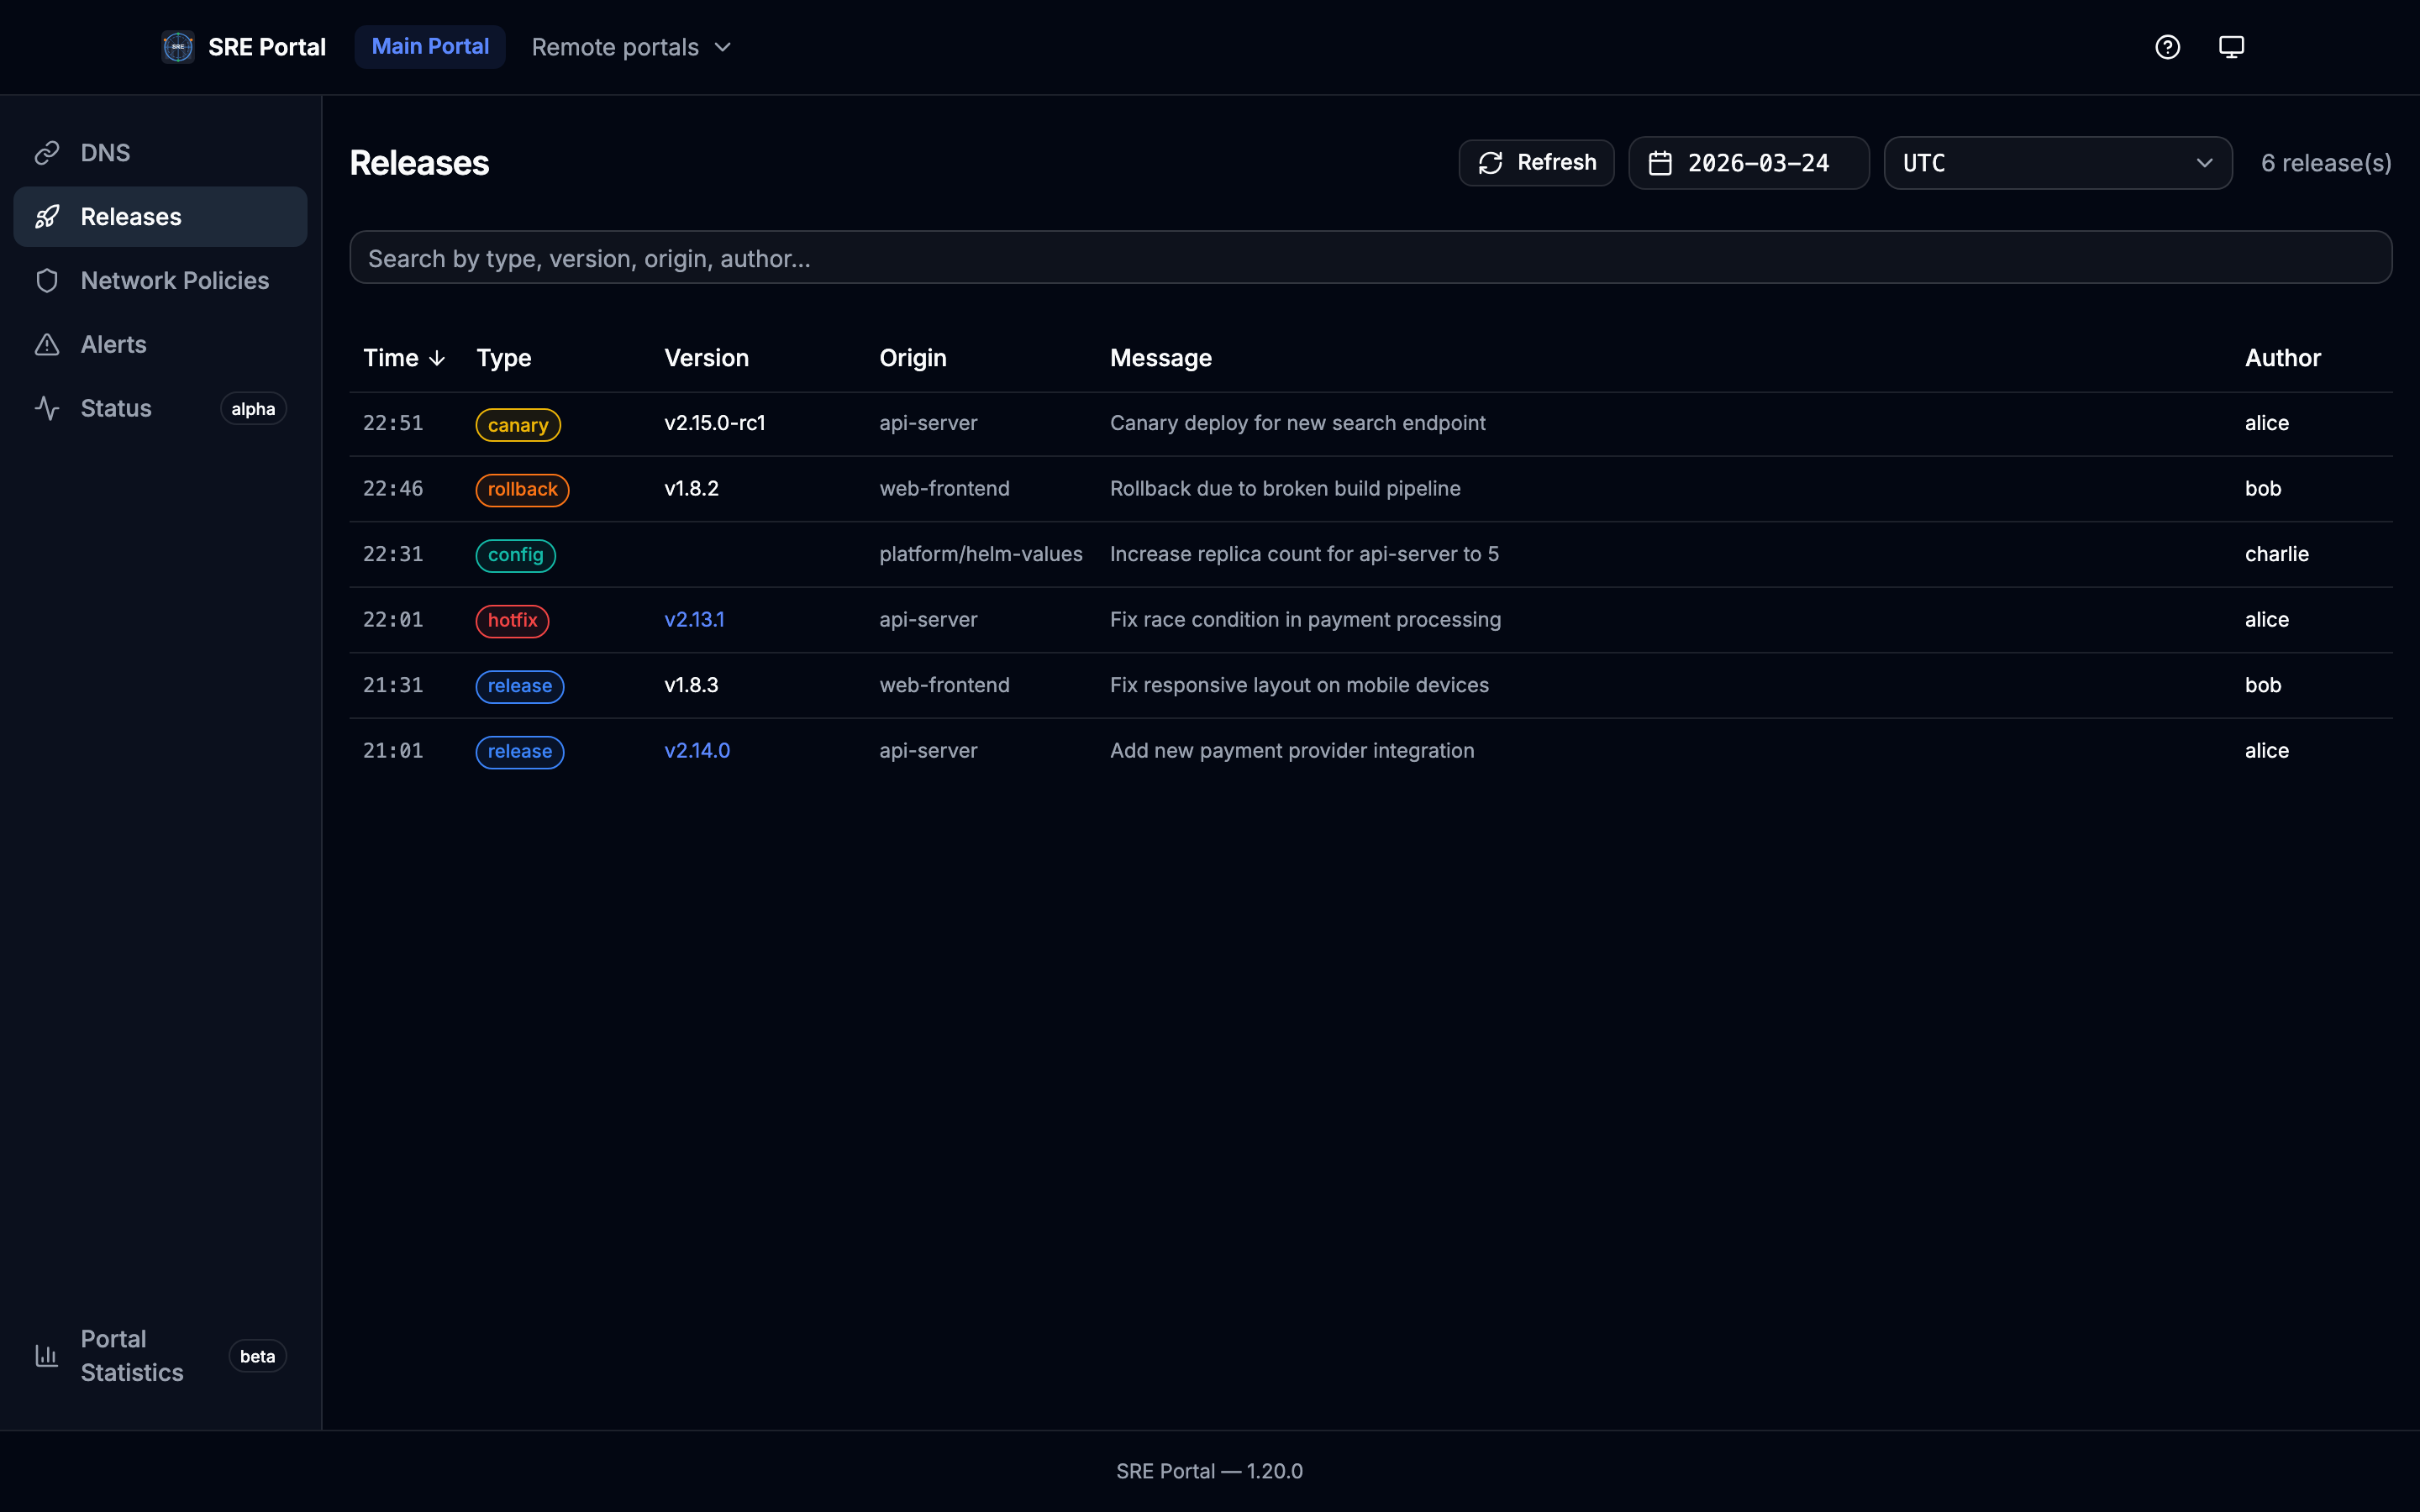
The Releases page is visible only on the main portal when at least one Release CR exists. It displays all release events for a given day in a compact list, sorted by date (most recent first).
Features:
- Date picker: calendar limited to the TTL window (from
ListReleaseDays: days with data andttl_daysfrom operator config) - Timezone selector: display entry times in a chosen IANA timezone (common zones preset)
- Keyword search: filter releases by type, version, origin, author, or message (case-insensitive)
- Compact layout: each release is a single row showing time, type badge, version, origin, message, author, and an external link icon
- Configurable type colors: type badge colors are driven by the operator’s
release.typesconfiguration. When no types are configured, built-in default colors are used
Images Page
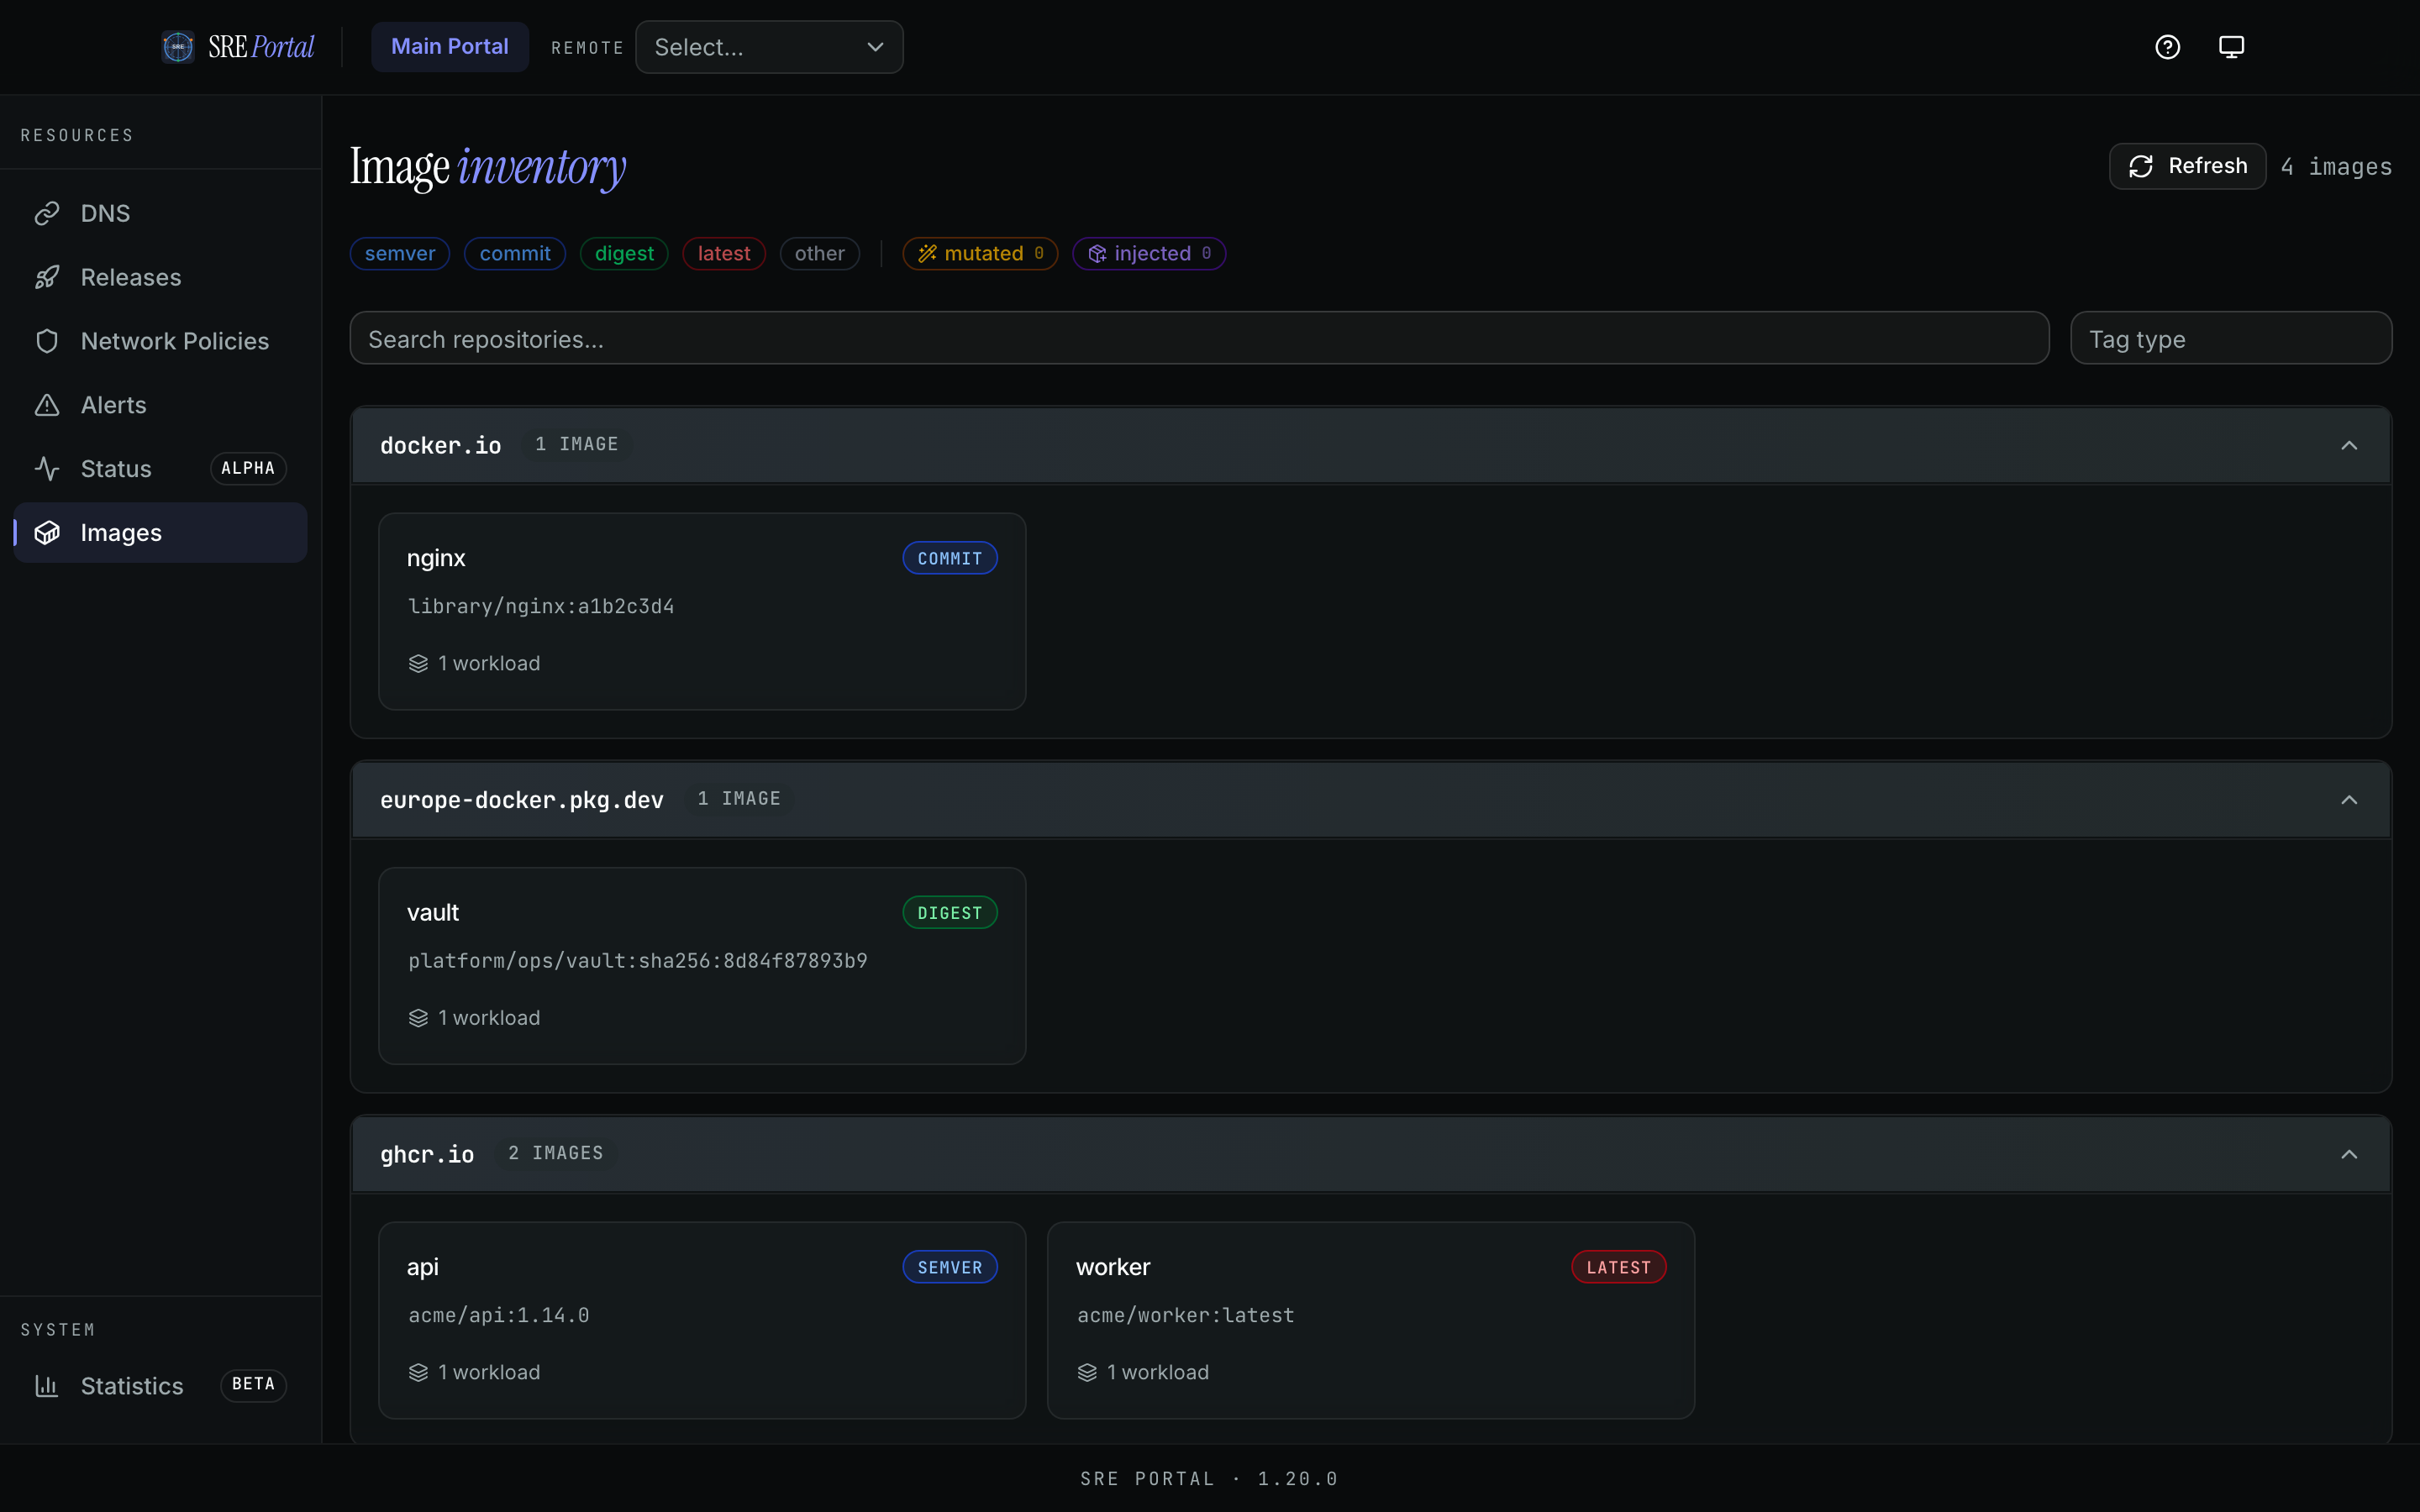
The Images page inventories Docker images used by workloads for the selected portal. Results are grouped by registry and each image shows repository, tag, tag type, and workload count.
Features:
- Tag type summary: quick filters for
semver,commit,digest,latest, andother - Search: filter by repository path
- Registry grouping: collapsible cards per registry
- Per-image details: short name, full repository/tag, tag type badge, and workload usage count
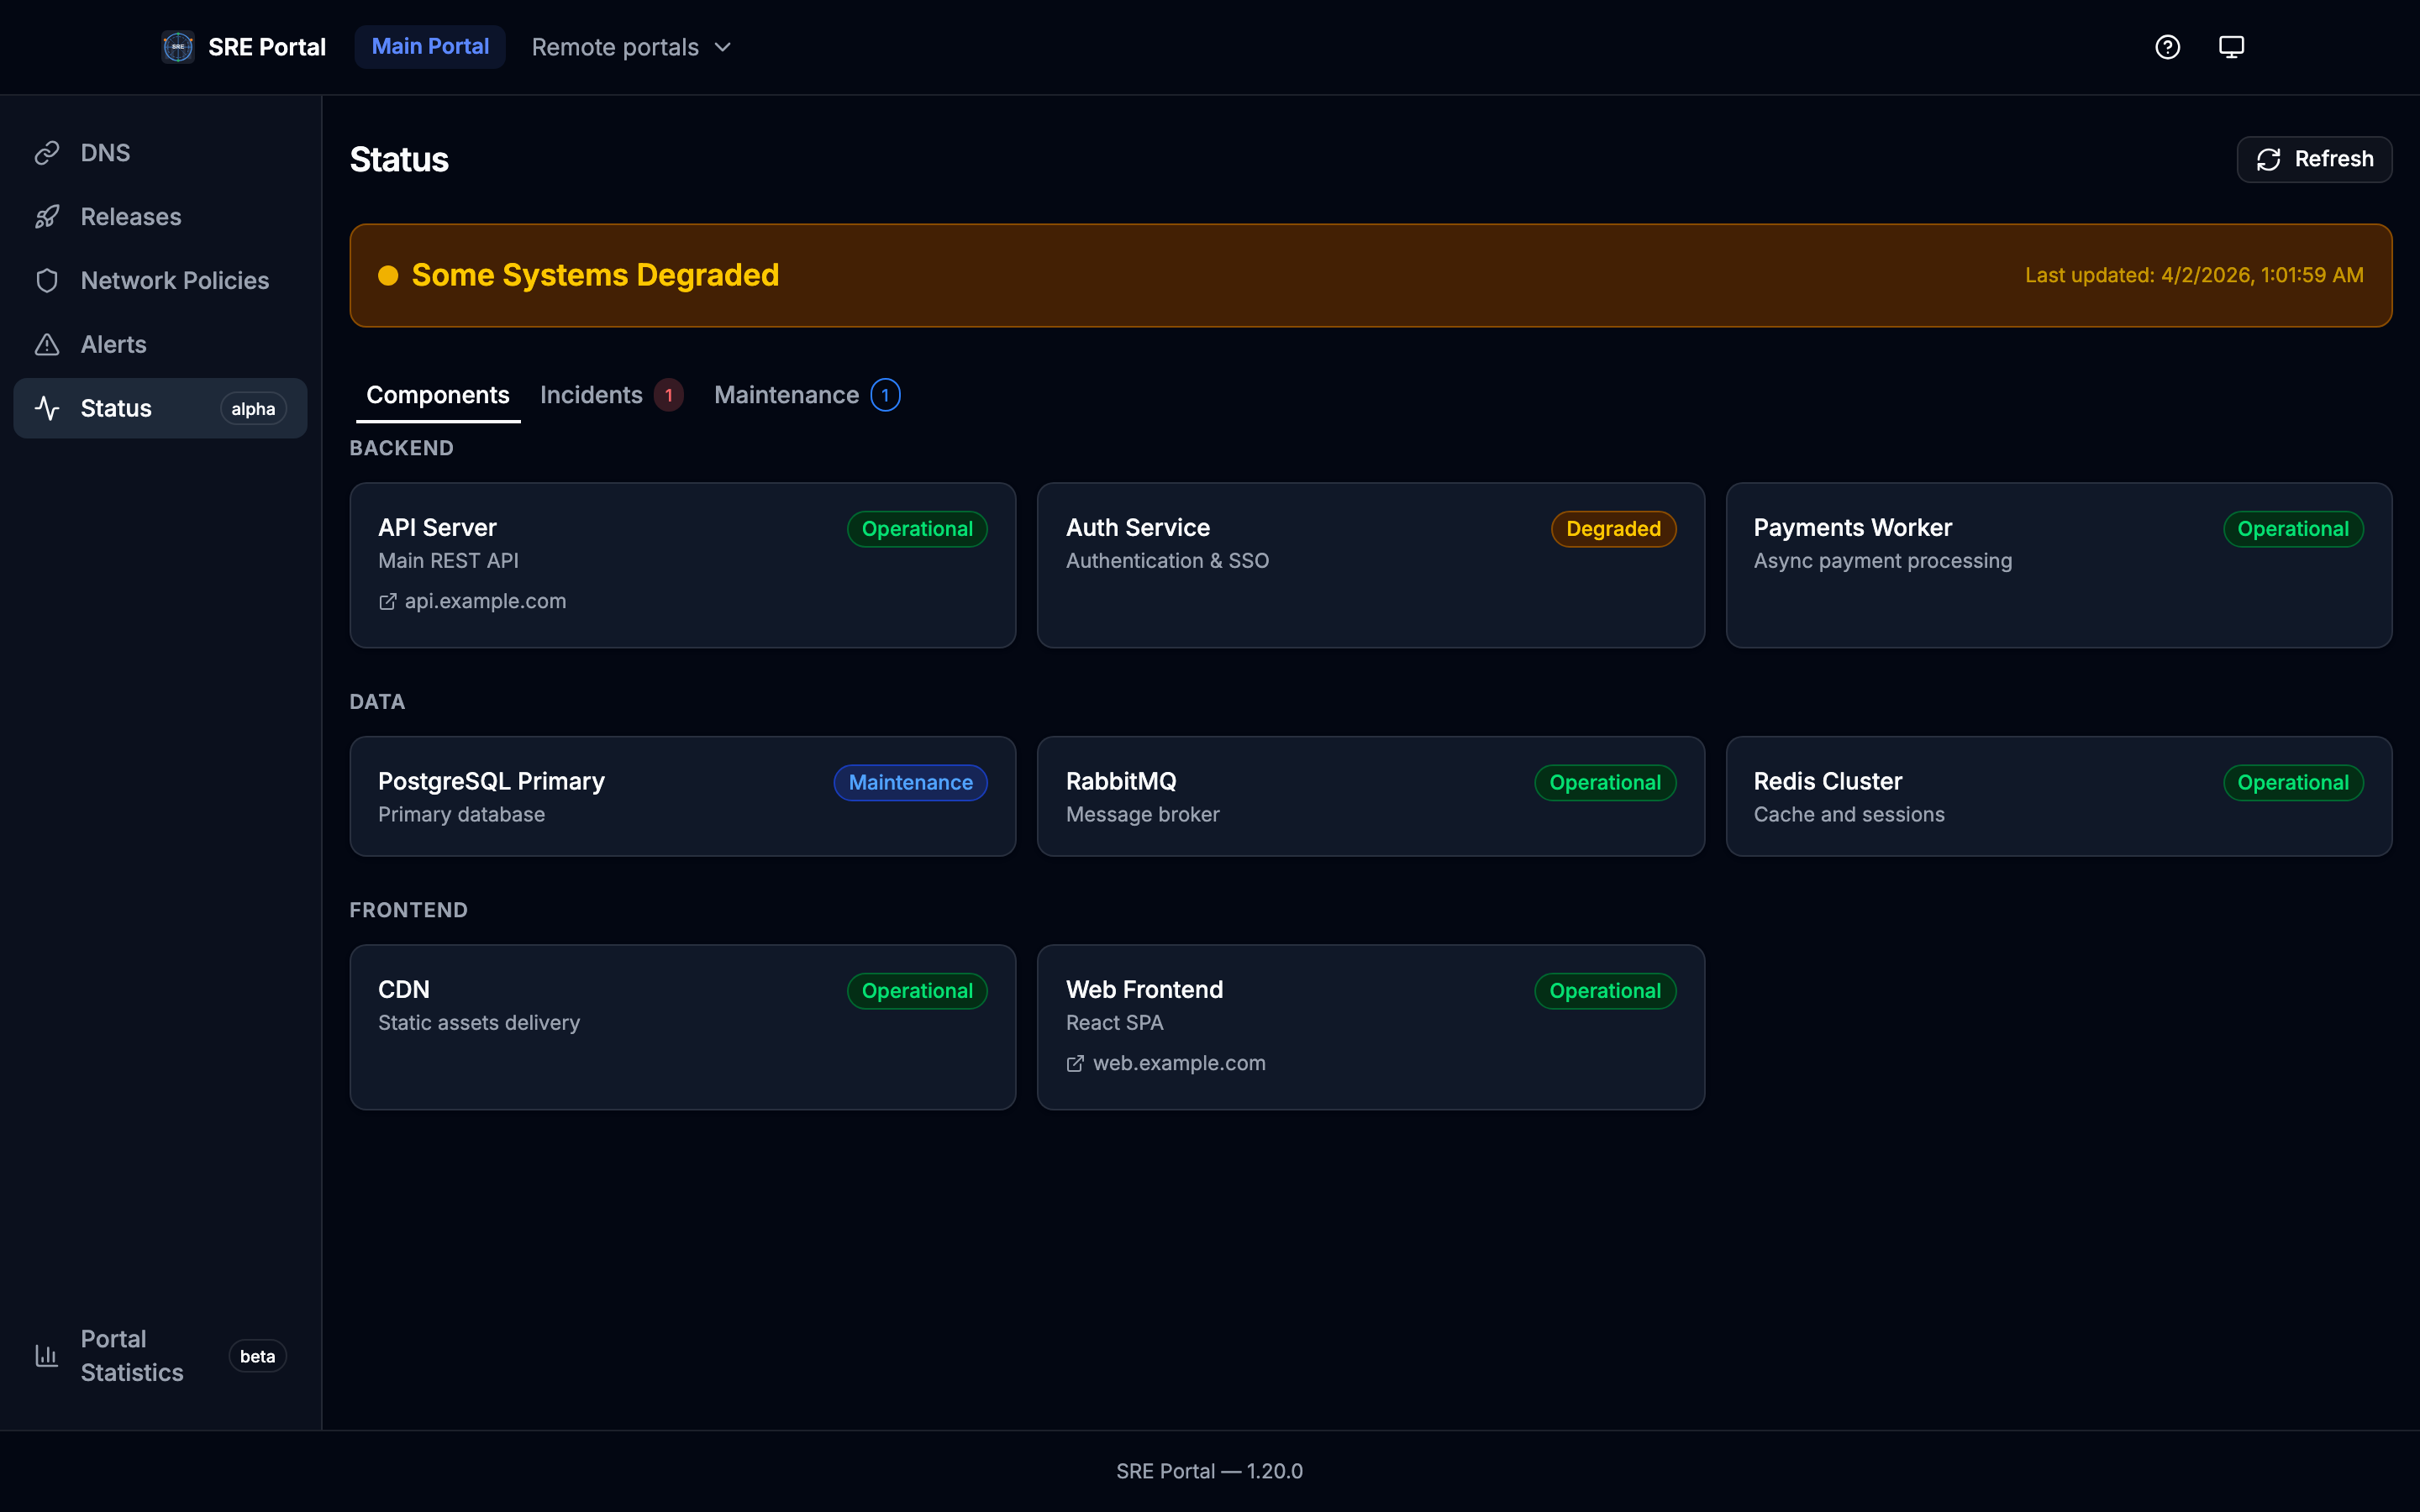
Status Page
The Status page provides a real-time view of platform health, organized into three tabs:
- Components — grouped by section, each showing computed status (operational, degraded, maintenance, partial/major outage)
- Incidents — active incidents expanded by default with severity, phase, and timeline updates; resolved incidents collapsed below
- Maintenance — scheduled and in-progress maintenance windows with affected components and time ranges
See Status Page for CRD definitions and API details.
Portal Navigation
When multiple portals exist, the navigation bar allows switching between portals. Each portal shows only the FQDNs (and alerts) routed to it. The Dashboard uses the same portal segment in the URL but always reflects cluster-wide operator metrics.
Theme Toggle
The toolbar includes a theme toggle button that cycles between light, dark, and system modes. The selected theme is persisted in localStorage and applied via CSS class on the <html> element using Tailwind’s dark mode class strategy.
Dashboard Page
The Dashboard page displays key metrics from the operator’s Prometheus registry in visual charts, providing an at-a-glance overview of reconciliation rates, FQDN counts, active alerts, and HTTP request rates.
Help / MCP Page
The Help page (/help) provides:
- Four MCP endpoints: DNS/portals (
/mcpor/mcp/dns), Alerts (/mcp/alerts), Metrics (/mcp/metrics), and Releases (/mcp/releases), each with its tools table - Tools:
search_fqdns,list_portals,get_fqdn_details(DNS);list_alerts(Alerts);list_metrics(Metrics);list_releases(Releases) - Setup instructions for Claude Desktop, Claude Code, and Cursor with copy-to-clipboard config snippets
- Example queries to try with an AI assistant
Technology Stack
The web UI is built with:
- React 19 with functional components and hooks
- Vite for development server and production bundling
- Tailwind CSS v4 for styling
- shadcn/ui (Radix UI primitives) for UI components
- TanStack Query v5 for server state and data fetching
- React Router v7 for client-side routing
- Connect protocol clients for gRPC communication with the backend
- Buf-generated TypeScript clients (in
web/src/gen/)
The React app is compiled at build time and served as static files by the Echo v5 web server inside the operator container.